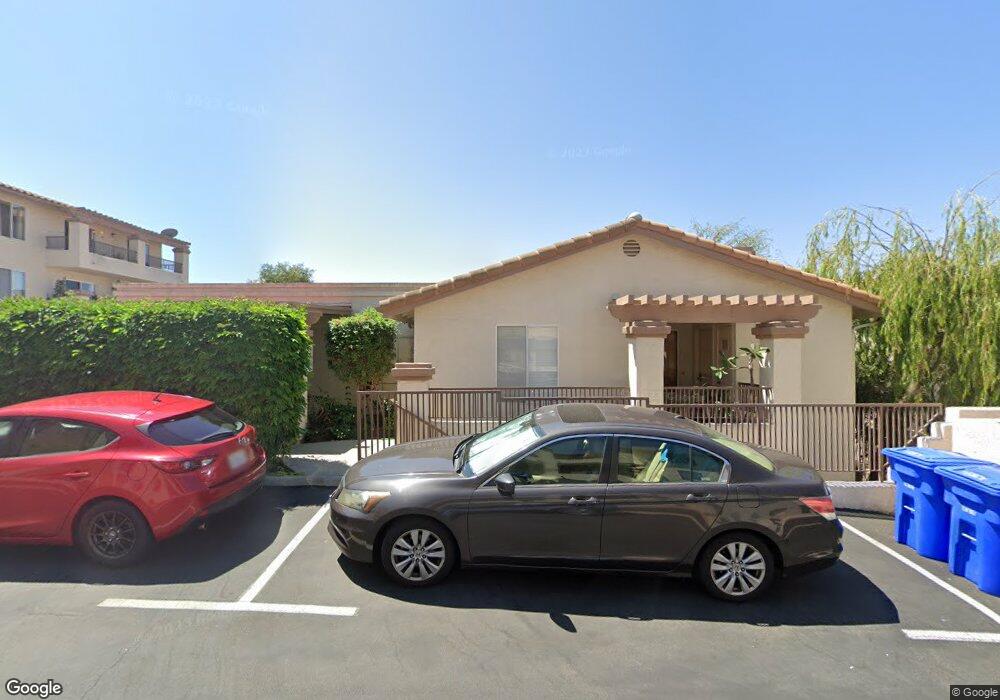
7382 Altiva Place Unit 43 Carlsbad, CA 92009
La Costa NeighborhoodEstimated Value: $647,347 - $803,000
2
Beds
2
Baths
1,032
Sq Ft
$689/Sq Ft
Est. Value
About This Home
This home is located at 7382 Altiva Place Unit 43, Carlsbad, CA 92009 and is currently estimated at $711,087, approximately $689 per square foot. 7382 Altiva Place Unit 43 is a home located in San Diego County with nearby schools including La Costa Meadows Elementary, San Elijo Middle School, and San Marcos High School.
Ownership History
Date
Name
Owned For
Owner Type
Purchase Details
Closed on
Mar 9, 2021
Sold by
Hutzler Stacey and Hutzler Mark
Bought by
Hutzler Stacey and Hutzler Mark
Current Estimated Value
Home Financials for this Owner
Home Financials are based on the most recent Mortgage that was taken out on this home.
Original Mortgage
$117,400
Outstanding Balance
$87,364
Interest Rate
2.9%
Mortgage Type
New Conventional
Estimated Equity
$623,723
Purchase Details
Closed on
Mar 28, 2002
Sold by
Quinzi Helen F
Bought by
Kopstein Stacey
Home Financials for this Owner
Home Financials are based on the most recent Mortgage that was taken out on this home.
Original Mortgage
$189,800
Interest Rate
7.08%
Purchase Details
Closed on
Oct 13, 1989
Create a Home Valuation Report for This Property
The Home Valuation Report is an in-depth analysis detailing your home's value as well as a comparison with similar homes in the area
Home Values in the Area
Average Home Value in this Area
Purchase History
| Date | Buyer | Sale Price | Title Company |
|---|---|---|---|
| Hutzler Stacey | -- | Accommodation | |
| Kopstein Stacey | $211,000 | Chicago Title Co | |
| -- | $146,700 | -- |
Source: Public Records
Mortgage History
| Date | Status | Borrower | Loan Amount |
|---|---|---|---|
| Open | Hutzler Stacey | $117,400 | |
| Closed | Kopstein Stacey | $189,800 |
Source: Public Records
Tax History Compared to Growth
Tax History
| Year | Tax Paid | Tax Assessment Tax Assessment Total Assessment is a certain percentage of the fair market value that is determined by local assessors to be the total taxable value of land and additions on the property. | Land | Improvement |
|---|---|---|---|---|
| 2025 | $3,832 | $311,694 | $169,882 | $141,812 |
| 2024 | $3,832 | $305,583 | $166,551 | $139,032 |
| 2023 | $3,708 | $299,592 | $163,286 | $136,306 |
| 2022 | $3,611 | $293,719 | $160,085 | $133,634 |
| 2021 | $3,519 | $287,961 | $156,947 | $131,014 |
| 2020 | $3,460 | $285,009 | $155,338 | $129,671 |
| 2019 | $3,446 | $279,422 | $152,293 | $127,129 |
| 2018 | $3,369 | $273,944 | $149,307 | $124,637 |
| 2017 | $91 | $268,574 | $146,380 | $122,194 |
| 2016 | $3,259 | $263,309 | $143,510 | $119,799 |
| 2015 | $3,186 | $259,355 | $141,355 | $118,000 |
| 2014 | $3,092 | $254,276 | $138,587 | $115,689 |
Source: Public Records
Map
Nearby Homes
- 7394 Altiva Place
- 2402 Altisma Way Unit G
- 2412 Altisma Way Unit D
- 2388 Altisma Way Unit 10
- 2364 Altisma Way Unit A
- 2647 Marmol Ct
- 2349 Altisma Way Unit B
- 2904 Avenida Valera
- 2871 Torry Ct
- 2916 Avenida Valera
- 7319 Bolero St
- 2323 Caringa Way Unit 16
- 2508 Navarra Dr Unit 424
- 2506 Navarra Dr Unit 618
- 2610 Acuna Ct
- 7373 Alicante Rd Unit 12
- 2319 Caringa Way Unit 58
- 2544 Navarra Dr Unit 17
- 2564 Navarra Dr Unit 213
- 2564 Navarra Dr Unit 115
- 7382 Altiva Place
- 7374 Altiva Place
- 7396 Altiva Place
- 7384 Altiva Place
- 7404 Altiva Place Unit L49
- 7398 Altiva Place Unit L56
- 7378 Altiva Place
- 7388 Altiva Place
- 7392 Altiva Place
- 7400 Altiva Place
- 7402 Altiva Place Unit L48
- 7406 Altiva Place
- 7380 Altiva Place
- 7372 Altiva Place
- 7370 Altiva Place
- 7376 Altiva Place
- 7410 Altiva Place Unit L52
- 7408 Altiva Place
- 7414 Altiva Place
- 7426 Altiva Place