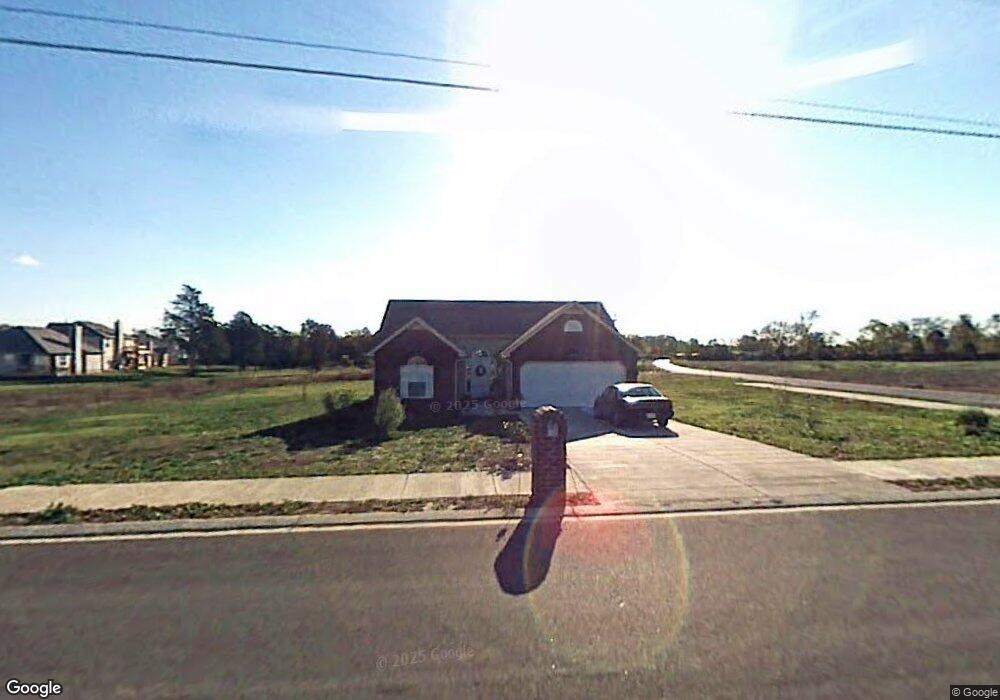
739 Clear Cir Smyrna, TN 37167
Estimated Value: $308,000 - $341,548
--
Bed
--
Bath
1,221
Sq Ft
$271/Sq Ft
Est. Value
About This Home
This home is located at 739 Clear Cir, Smyrna, TN 37167 and is currently estimated at $331,137, approximately $271 per square foot. 739 Clear Cir is a home located in Rutherford County with nearby schools including Rocky Fork Elementary School, Rocky Fork Middle School, and Smyrna High School.
Ownership History
Date
Name
Owned For
Owner Type
Purchase Details
Closed on
Oct 14, 2017
Sold by
Jennings Sheila D and Jennings Thomas
Bought by
Jennings Sheila D and Jennings Sheila D
Current Estimated Value
Home Financials for this Owner
Home Financials are based on the most recent Mortgage that was taken out on this home.
Original Mortgage
$150,590
Outstanding Balance
$128,387
Interest Rate
4.62%
Mortgage Type
FHA
Estimated Equity
$202,750
Purchase Details
Closed on
May 9, 2011
Sold by
Federal Home Loan Mortgage Corporation
Bought by
Moore Sheila D
Home Financials for this Owner
Home Financials are based on the most recent Mortgage that was taken out on this home.
Original Mortgage
$107,113
Interest Rate
4.75%
Mortgage Type
FHA
Purchase Details
Closed on
Feb 24, 2011
Sold by
Wilson Jeffery
Bought by
Federal Home Loan Mortgage Corporation
Purchase Details
Closed on
Sep 1, 2006
Sold by
Butler Kelly Builders Llc
Bought by
Jeffery Wilson
Create a Home Valuation Report for This Property
The Home Valuation Report is an in-depth analysis detailing your home's value as well as a comparison with similar homes in the area
Home Values in the Area
Average Home Value in this Area
Purchase History
| Date | Buyer | Sale Price | Title Company |
|---|---|---|---|
| Jennings Sheila D | -- | None Available | |
| Moore Sheila D | $109,900 | -- | |
| Federal Home Loan Mortgage Corporation | $93,500 | -- | |
| Jeffery Wilson | $148,200 | -- | |
| Jeffery Wilson | $148,200 | -- |
Source: Public Records
Mortgage History
| Date | Status | Borrower | Loan Amount |
|---|---|---|---|
| Open | Jennings Sheila D | $150,590 | |
| Closed | Moore Sheila D | $107,113 |
Source: Public Records
Tax History Compared to Growth
Tax History
| Year | Tax Paid | Tax Assessment Tax Assessment Total Assessment is a certain percentage of the fair market value that is determined by local assessors to be the total taxable value of land and additions on the property. | Land | Improvement |
|---|---|---|---|---|
| 2025 | $1,585 | $66,000 | $13,750 | $52,250 |
| 2024 | $1,585 | $66,000 | $13,750 | $52,250 |
| 2023 | $1,567 | $65,250 | $13,750 | $51,500 |
| 2022 | $1,398 | $65,250 | $13,750 | $51,500 |
| 2021 | $1,285 | $44,025 | $8,750 | $35,275 |
| 2020 | $1,285 | $44,025 | $8,750 | $35,275 |
| 2019 | $1,285 | $44,025 | $8,750 | $35,275 |
Source: Public Records
Map
Nearby Homes
- 3480 Gambill Ln
- 708 Rock Glen Trace
- 920 Sky Valley Trail
- 1011 Sky Valley Trail
- 753 Lipizanner Ln
- 0 Gambill Ln
- 165 Gallant Fox Dr
- 305 Wildwood Dr
- 294 Sundale Dr
- 2302 Rocky Fork Rd
- 620 General Barksdale Dr
- 510 Lydia Ashley Ln
- 490 Lydia Ashley Ln
- 512 D Ann Dr
- 412 Gooding Blvd
- 508 Restoration Dr
- 607 General Barksdale Dr
- 429 Bountiful Dr
- 131 Tedder Blvd
- 428 Bountiful Dr