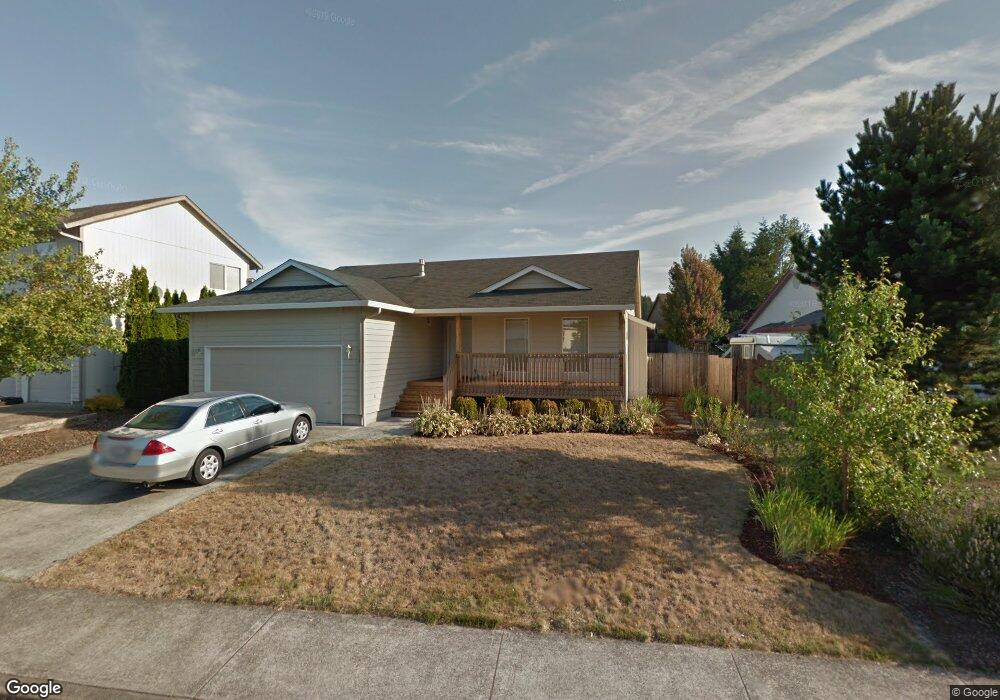
739 E Heritage Loop La Center, WA 98629
Estimated Value: $476,253 - $617,000
3
Beds
2
Baths
1,544
Sq Ft
$335/Sq Ft
Est. Value
About This Home
This home is located at 739 E Heritage Loop, La Center, WA 98629 and is currently estimated at $516,563, approximately $334 per square foot. 739 E Heritage Loop is a home located in Clark County with nearby schools including La Center Elementary School, La Center Middle School, and La Center High School.
Ownership History
Date
Name
Owned For
Owner Type
Purchase Details
Closed on
Aug 13, 2001
Sold by
Wheeler Wade H and Wheeler Kiv M
Bought by
Lucas Reeb and Lucas Sharon L
Current Estimated Value
Home Financials for this Owner
Home Financials are based on the most recent Mortgage that was taken out on this home.
Original Mortgage
$100,000
Outstanding Balance
$38,585
Interest Rate
7%
Estimated Equity
$477,978
Purchase Details
Closed on
Aug 14, 1998
Sold by
Oja Robert L and Oja Bonnie M
Bought by
Wheeler Wade H and Wheeler Kiv M
Home Financials for this Owner
Home Financials are based on the most recent Mortgage that was taken out on this home.
Original Mortgage
$99,400
Interest Rate
6.95%
Purchase Details
Closed on
May 8, 1997
Sold by
New Castle Investments Inc
Bought by
Oja Robert L and Oja Bonnie M
Create a Home Valuation Report for This Property
The Home Valuation Report is an in-depth analysis detailing your home's value as well as a comparison with similar homes in the area
Home Values in the Area
Average Home Value in this Area
Purchase History
| Date | Buyer | Sale Price | Title Company |
|---|---|---|---|
| Lucas Reeb | $148,400 | First American Title | |
| Wheeler Wade H | $142,000 | Transnation Title Insurance | |
| Oja Robert L | $44,900 | First American Title Ins Co |
Source: Public Records
Mortgage History
| Date | Status | Borrower | Loan Amount |
|---|---|---|---|
| Open | Lucas Reeb | $100,000 | |
| Previous Owner | Wheeler Wade H | $99,400 |
Source: Public Records
Tax History
| Year | Tax Paid | Tax Assessment Tax Assessment Total Assessment is a certain percentage of the fair market value that is determined by local assessors to be the total taxable value of land and additions on the property. | Land | Improvement |
|---|---|---|---|---|
| 2025 | $3,833 | $427,225 | $154,500 | $272,725 |
| 2024 | $3,579 | $413,170 | $154,500 | $258,670 |
| 2023 | $3,598 | $401,805 | $150,000 | $251,805 |
| 2022 | $3,482 | $390,223 | $136,500 | $253,723 |
| 2021 | $3,447 | $335,110 | $109,200 | $225,910 |
| 2020 | $3,305 | $312,452 | $101,400 | $211,052 |
| 2019 | $3,194 | $292,872 | $91,260 | $201,612 |
| 2018 | $2,924 | $288,057 | $0 | $0 |
| 2017 | $2,523 | $259,900 | $0 | $0 |
| 2016 | $1,261 | $237,696 | $0 | $0 |
Source: Public Records
Map
Nearby Homes
- 734 E 15th Cir
- 1241 E Southview Heights Dr
- 1189 E Ennis Ct
- 703 E Stonecreek Dr
- 525 E 17th Cir
- 108 W 16th St
- 1296 E Lucas St
- 1319 Aspen Ave
- 1214 W Avocet Place
- 1202 W Avocet Place
- 594 E 5th St
- 725 Aspen Ave
- 135 E Airedale Ave
- 142 W 20th Way
- 403 W 19th St
- 404 W 20th Way
- 410 W 20th Way
- 516 W 20th Way
- 521 W 20th Way
- 134 E Joyce Ct
- 743 E Heritage Loop
- 737 E Heritage Loop
- 742 E 15th Cir
- 729 E Heritage Loop
- 738 E 15th Cir
- 740 E Heritage Loop
- 831 E Heritage Loop
- 820 E 15th Cir
- 736 E Heritage Loop
- 744 E Heritage Loop
- 725 E Heritage Loop
- 732 E Heritage Loop
- 730 E 15th Cir
- 802 E Heritage Loop
- 863 E Heritage Loop
- 844 E 15th Cir
- 728 E Heritage Loop
- 0 E 15th Cir Unit 676562
- 741 E 15th Cir
- 637 E Pioneer Loop
Your Personal Tour Guide
Ask me questions while you tour the home.