739 Loop St Miamisburg, OH 45342
Downtown Miamisburg NeighborhoodEstimated Value: $170,000 - $218,274
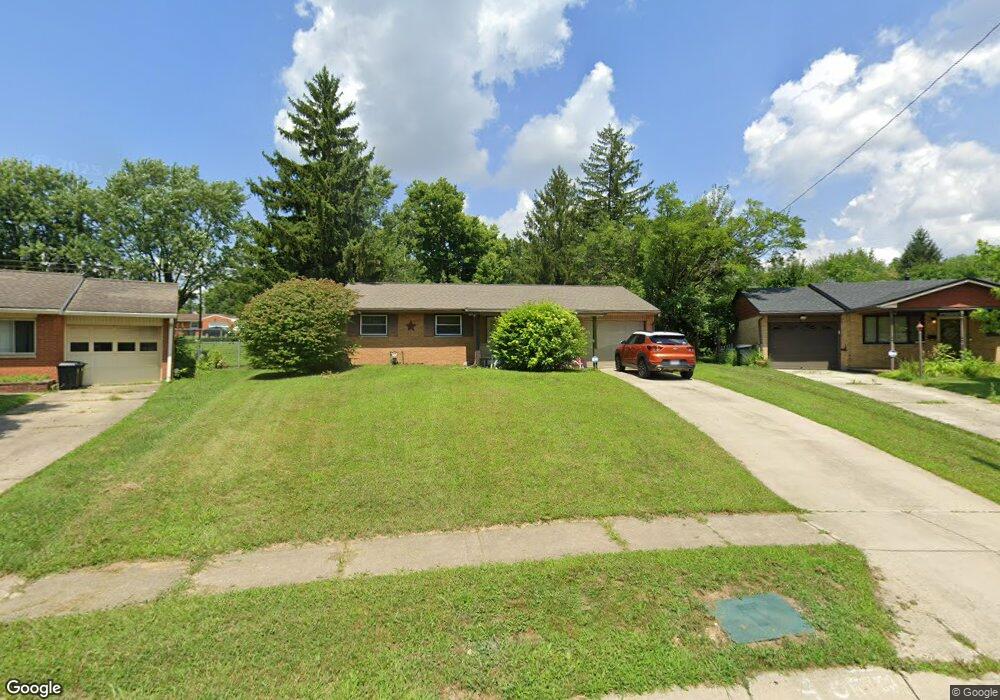
About This Home
This home is located at 739 Loop St, Miamisburg, OH 45342 and is currently estimated at $191,069, approximately $163 per square foot. 739 Loop St is a home located in Montgomery County with nearby schools including Miamisburg High School and Bethel Baptist School.
Ownership History
We collect this data history from publicly available records. To have your information removed, we recommend requesting removal directly through your county’s website.
Purchase Details
Home Financials for this Owner
Home Financials are based on the most recent Mortgage that was taken out on this home.Purchase Details
Purchase Details
Home Financials for this Owner
Home Financials are based on the most recent Mortgage that was taken out on this home.Home Values in the Area
Average Home Value in this Area
Purchase History
We collect this data history from publicly available records. To have your information removed, we recommend requesting removal directly through your county’s website.
| Date | Buyer | Sale Price | Title Company |
|---|---|---|---|
| $84,000 | Chicago Title Agency Llc | ||
| -- | Attorney | ||
| $82,000 | -- |
Mortgage History
We collect this data history from publicly available records. To have your information removed, we recommend requesting removal directly through your county’s website.
| Date | Status | Borrower | Loan Amount |
|---|---|---|---|
| Open | $82,478 | ||
| Previous Owner | $81,900 |
Tax History
We collect this data history from publicly available records. To have your information removed, we recommend requesting removal directly through your county’s website.
| Year | Tax Paid | Tax Assessment Tax Assessment Total Assessment is a certain percentage of the fair market value that is determined by local assessors to be the total taxable value of land and additions on the property. | Land | Improvement |
|---|---|---|---|---|
| 2025 | $3,403 | $52,190 | $10,430 | $41,760 |
| 2024 | $3,318 | $52,190 | $10,430 | $41,760 |
| 2023 | $3,318 | $52,190 | $10,430 | $41,760 |
| 2022 | $2,647 | $35,030 | $7,000 | $28,030 |
| 2021 | $2,342 | $35,030 | $7,000 | $28,030 |
| 2020 | $2,336 | $35,030 | $7,000 | $28,030 |
| 2019 | $2,177 | $29,930 | $7,000 | $22,930 |
| 2018 | $2,184 | $29,930 | $7,000 | $22,930 |
| 2017 | $2,169 | $29,930 | $7,000 | $22,930 |
| 2016 | $1,924 | $25,550 | $7,000 | $18,550 |
| 2015 | $2,103 | $25,550 | $7,000 | $18,550 |
| 2014 | $2,103 | $25,550 | $7,000 | $18,550 |
| 2012 | -- | $33,140 | $10,780 | $22,360 |
Map
- 950 N 12th St
- 1146 E Lindsey Ave
- 1124 Case Ct
- 1019 Richard St
- 1131 N 11th St
- 829 Cottage Ave
- 934 Williams St
- 915 Carole St
- 922 Williams St
- 803 Kercher St
- 908 E Pearl St
- 1609 Kathy Ln
- 1039 E Central Ave
- 815 E Pearl St
- 638 Sennett St
- 860 Lea Castle Place
- 744 E Pearl St
- 1318 Sierra Ridge Dr
- 1725 S Bayberry Dr
- 555 E Sycamore St
Ask me questions while you tour the home.