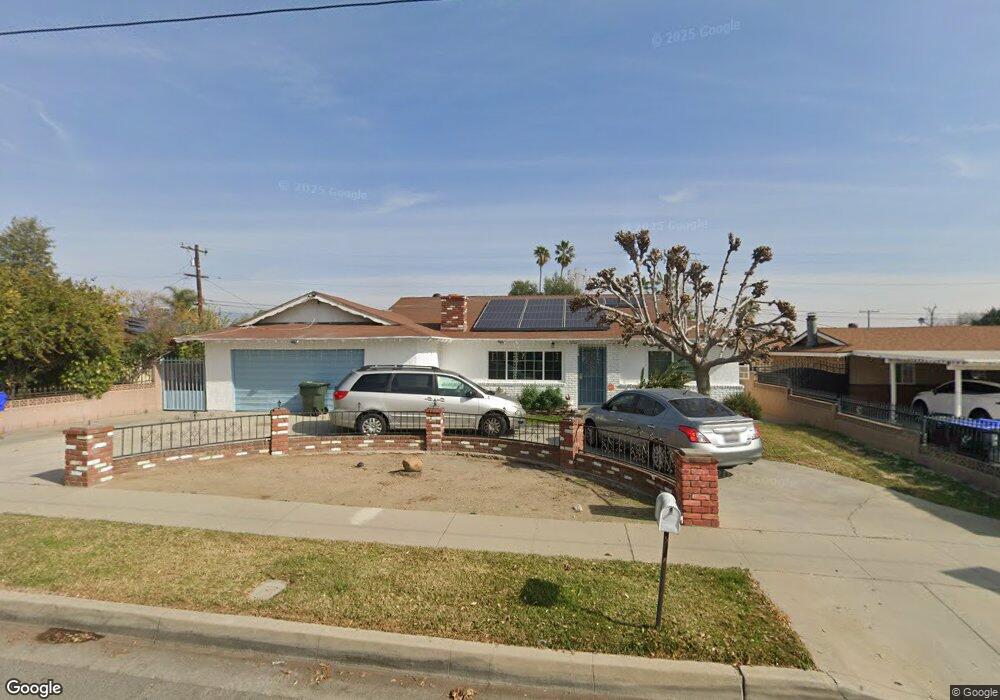
739 N Meridian Ave San Bernardino, CA 92410
Terrace NeighborhoodEstimated Value: $476,000 - $561,000
3
Beds
2
Baths
1,440
Sq Ft
$357/Sq Ft
Est. Value
About This Home
This home is located at 739 N Meridian Ave, San Bernardino, CA 92410 and is currently estimated at $514,080, approximately $357 per square foot. 739 N Meridian Ave is a home located in San Bernardino County with nearby schools including Myers Elementary School, Frisbie Middle School, and Eisenhower High School.
Ownership History
Date
Name
Owned For
Owner Type
Purchase Details
Closed on
Aug 6, 2009
Sold by
Federal National Mortgage Association
Bought by
Padilla Ricardo and Padilla Diana A Ochoa
Current Estimated Value
Home Financials for this Owner
Home Financials are based on the most recent Mortgage that was taken out on this home.
Original Mortgage
$97,000
Interest Rate
5.25%
Mortgage Type
New Conventional
Purchase Details
Closed on
Feb 4, 2009
Sold by
Robinson Errin B
Bought by
Federal National Mortgage Association
Purchase Details
Closed on
Jun 15, 2000
Sold by
Hud
Bought by
Robinson Errin B
Home Financials for this Owner
Home Financials are based on the most recent Mortgage that was taken out on this home.
Original Mortgage
$52,812
Interest Rate
8.12%
Mortgage Type
FHA
Purchase Details
Closed on
Nov 3, 1999
Sold by
Fleet Mtg Corp
Bought by
Hud
Purchase Details
Closed on
Nov 1, 1999
Sold by
Boston Dwyane and Boston Mercile
Bought by
Fleet Mtg Corp and Fleet Real Estate Funding Corp
Create a Home Valuation Report for This Property
The Home Valuation Report is an in-depth analysis detailing your home's value as well as a comparison with similar homes in the area
Home Values in the Area
Average Home Value in this Area
Purchase History
| Date | Buyer | Sale Price | Title Company |
|---|---|---|---|
| Padilla Ricardo | $100,000 | Lsi Title Agency | |
| Federal National Mortgage Association | $116,054 | First American | |
| Robinson Errin B | $98,500 | First American Title Co | |
| Hud | -- | First Southwestern Title | |
| Fleet Mtg Corp | $105,880 | First Southwestern Title Co |
Source: Public Records
Mortgage History
| Date | Status | Borrower | Loan Amount |
|---|---|---|---|
| Previous Owner | Padilla Ricardo | $97,000 | |
| Previous Owner | Robinson Errin B | $52,812 | |
| Closed | Robinson Errin B | $45,500 |
Source: Public Records
Tax History Compared to Growth
Tax History
| Year | Tax Paid | Tax Assessment Tax Assessment Total Assessment is a certain percentage of the fair market value that is determined by local assessors to be the total taxable value of land and additions on the property. | Land | Improvement |
|---|---|---|---|---|
| 2025 | $1,633 | $129,085 | $38,725 | $90,360 |
| 2024 | $1,633 | $126,554 | $37,966 | $88,588 |
| 2023 | $1,724 | $124,073 | $37,222 | $86,851 |
| 2022 | $1,605 | $121,640 | $36,492 | $85,148 |
| 2021 | $1,589 | $119,254 | $35,776 | $83,478 |
| 2020 | $1,593 | $118,031 | $35,409 | $82,622 |
| 2019 | $1,559 | $115,717 | $34,715 | $81,002 |
| 2018 | $1,515 | $113,448 | $34,034 | $79,414 |
| 2017 | $1,499 | $111,224 | $33,367 | $77,857 |
| 2016 | $1,477 | $109,043 | $32,713 | $76,330 |
| 2015 | $1,333 | $107,405 | $32,222 | $75,183 |
| 2014 | $1,251 | $105,301 | $31,591 | $73,710 |
Source: Public Records
Map
Nearby Homes
- 2678 Etiwanda Ave
- 2606 Maple St
- 2837 7th St
- 556 N Marvin Dr
- 2495 Etiwanda Ave
- 565 N Meridian Ave
- 559 N Marvin Dr
- 555 N Meridian Ave
- 648 N Rosalind Ave
- 820 San Carlo Ave
- 665 N Pepper Ave
- 857 N Dallas Ave
- 2455 Saint Elmo Dr
- 1010 Terrace Rd Unit 24
- 1010 Terrace Rd Unit 52
- 1010 Terrace Rd Unit 38
- 1010 Terrace Rd Unit 177
- 1010 Terrace Rd
- 1010 Terrace Rd Unit 19
- 2279 W 7th St
- 749 N Meridian Ave
- 733 N Meridian Ave
- 744 N Marvin Dr
- 738 N Marvin Dr
- 757 N Meridian Ave
- 725 N Meridian Ave
- 754 N Marvin Dr
- 724 N Marvin Dr
- 740 N Meridian Ave
- 748 N Meridian Ave
- 732 N Meridian Ave
- 765 N Meridian Ave
- 2696 W 7th St
- 764 N Marvin Dr
- 756 N Meridian Ave
- 724 N Meridian Ave
- 2670 W 7th St
- 773 N Meridian Ave
- 704 N Meridian Ave
- 741 N Marvin Dr