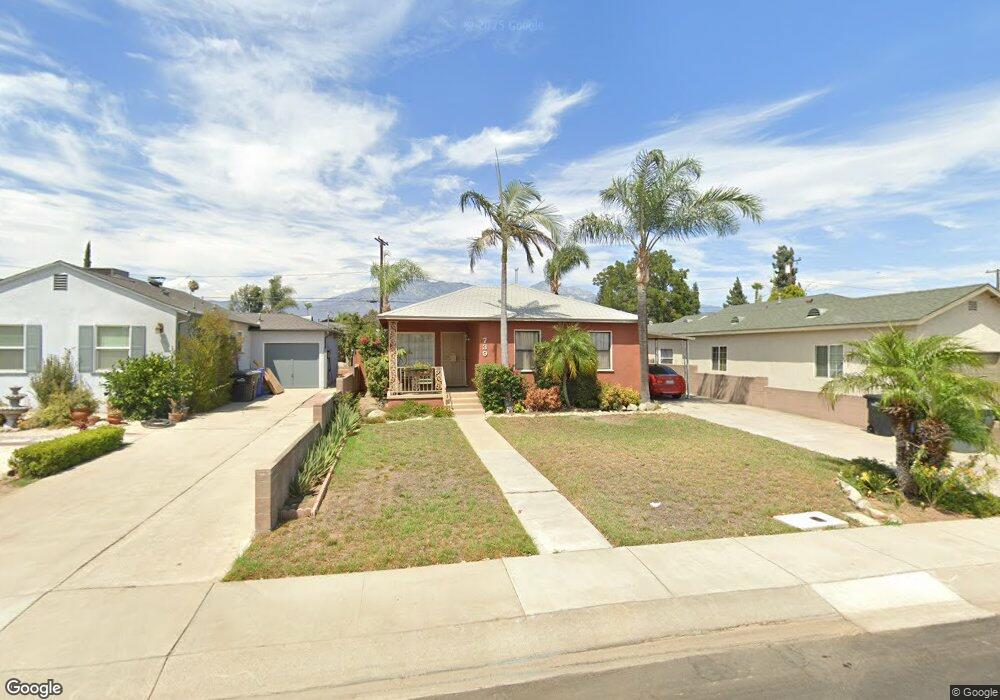
739 Plaza Serena Ontario, CA 91764
Downtown Ontario NeighborhoodEstimated Value: $596,297 - $636,000
2
Beds
1
Bath
1,170
Sq Ft
$533/Sq Ft
Est. Value
About This Home
This home is located at 739 Plaza Serena, Ontario, CA 91764 and is currently estimated at $623,074, approximately $532 per square foot. 739 Plaza Serena is a home located in San Bernardino County with nearby schools including Berlyn Elementary, Vina Danks Middle, and Chaffey High School.
Ownership History
Date
Name
Owned For
Owner Type
Purchase Details
Closed on
Apr 10, 2024
Sold by
Zarate Francisco and Anieva Juan
Bought by
Zarate Francisco
Current Estimated Value
Purchase Details
Closed on
Nov 12, 2002
Sold by
Pff Bank & Trust
Bought by
Zarate Francisco and Sanchez Margarita
Home Financials for this Owner
Home Financials are based on the most recent Mortgage that was taken out on this home.
Original Mortgage
$175,249
Interest Rate
6.06%
Mortgage Type
FHA
Purchase Details
Closed on
Sep 6, 2002
Sold by
Gomez Ronald R and Gomez Rosalie V
Bought by
Pff Bank & Trust
Purchase Details
Closed on
Jan 3, 2002
Sold by
Rivera Ana D
Bought by
Anieva Juan
Purchase Details
Closed on
Aug 29, 1994
Sold by
Ball Dennis R and Ball Sharon K
Bought by
Gomez Ronald R and Gomez Rosalie V
Home Financials for this Owner
Home Financials are based on the most recent Mortgage that was taken out on this home.
Original Mortgage
$91,200
Interest Rate
9.2%
Create a Home Valuation Report for This Property
The Home Valuation Report is an in-depth analysis detailing your home's value as well as a comparison with similar homes in the area
Home Values in the Area
Average Home Value in this Area
Purchase History
| Date | Buyer | Sale Price | Title Company |
|---|---|---|---|
| Zarate Francisco | -- | None Listed On Document | |
| Zarate Francisco | $178,000 | First American | |
| Pff Bank & Trust | -- | Chicago Title Company | |
| Anieva Juan | -- | First American | |
| Gomez Ronald R | $115,000 | Chicago Title Co |
Source: Public Records
Mortgage History
| Date | Status | Borrower | Loan Amount |
|---|---|---|---|
| Previous Owner | Zarate Francisco | $175,249 | |
| Previous Owner | Gomez Ronald R | $91,200 | |
| Closed | Gomez Ronald R | $19,600 |
Source: Public Records
Tax History
| Year | Tax Paid | Tax Assessment Tax Assessment Total Assessment is a certain percentage of the fair market value that is determined by local assessors to be the total taxable value of land and additions on the property. | Land | Improvement |
|---|---|---|---|---|
| 2025 | $2,769 | $257,805 | $90,233 | $167,572 |
| 2024 | $2,705 | $252,750 | $88,464 | $164,286 |
| 2023 | $2,627 | $247,792 | $86,730 | $161,062 |
| 2022 | $2,591 | $242,933 | $85,029 | $157,904 |
| 2021 | $2,574 | $238,170 | $83,362 | $154,808 |
| 2020 | $2,528 | $235,728 | $82,507 | $153,221 |
| 2019 | $2,505 | $231,106 | $80,889 | $150,217 |
| 2018 | $2,468 | $226,575 | $79,303 | $147,272 |
| 2017 | $2,379 | $222,132 | $77,748 | $144,384 |
| 2016 | $2,283 | $217,777 | $76,224 | $141,553 |
| 2015 | $2,267 | $214,506 | $75,079 | $139,427 |
| 2014 | $2,195 | $210,304 | $73,608 | $136,696 |
Source: Public Records
Map
Nearby Homes
- 712 E H St
- 1038 E J St
- 931 E Princeton St
- 326 E I St
- 535 N Allyn Ave
- 730 N Holmes Ave
- 405 E Harvard Place
- 958 E Flora St
- 1420 N Marcella
- 821 N Alameda Ave
- 811 E Nocta St
- 230 N Monterey Ave
- 522 N Parkside Dr
- 1039 E Elma St
- 1354 Virginia Ave
- 127 N Campus Ave
- 1320 N Grove Ave
- 839 Richland St
- 1097 Richland St
- 744 E Holt Blvd
Your Personal Tour Guide
Ask me questions while you tour the home.