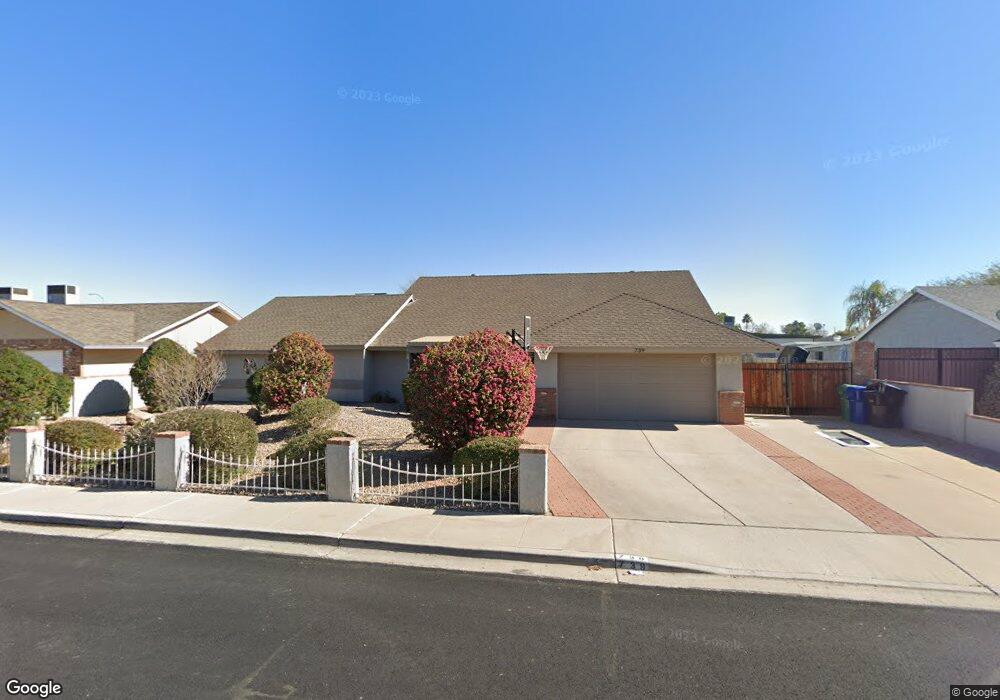
739 S 54th St Mesa, AZ 85206
Arizona Valencia NeighborhoodEstimated Value: $455,000 - $584,000
3
Beds
2
Baths
1,657
Sq Ft
$317/Sq Ft
Est. Value
About This Home
This home is located at 739 S 54th St, Mesa, AZ 85206 and is currently estimated at $525,132, approximately $316 per square foot. 739 S 54th St is a home located in Maricopa County with nearby schools including Madison Elementary School, Franklin at Brimhall Elementary School, and Franklin West Elementary School.
Ownership History
Date
Name
Owned For
Owner Type
Purchase Details
Closed on
Mar 10, 2004
Sold by
Hud
Bought by
Schelin Michael and Schelin Karrie
Current Estimated Value
Home Financials for this Owner
Home Financials are based on the most recent Mortgage that was taken out on this home.
Original Mortgage
$105,600
Outstanding Balance
$47,445
Interest Rate
5.12%
Mortgage Type
Purchase Money Mortgage
Estimated Equity
$477,687
Purchase Details
Closed on
Jan 7, 2004
Sold by
Us Bank Na
Bought by
Hud
Purchase Details
Closed on
Dec 16, 2003
Sold by
Hernandez Andres
Bought by
Us Bank Na
Purchase Details
Closed on
Aug 23, 2001
Sold by
Porter Scott W and Porter Connie S
Bought by
Hernandez Andres
Home Financials for this Owner
Home Financials are based on the most recent Mortgage that was taken out on this home.
Original Mortgage
$133,119
Interest Rate
7.21%
Mortgage Type
FHA
Create a Home Valuation Report for This Property
The Home Valuation Report is an in-depth analysis detailing your home's value as well as a comparison with similar homes in the area
Home Values in the Area
Average Home Value in this Area
Purchase History
| Date | Buyer | Sale Price | Title Company |
|---|---|---|---|
| Schelin Michael | -- | First Southwestern Title | |
| Hud | -- | -- | |
| Hud | -- | -- | |
| Us Bank Na | $144,235 | -- | |
| Hernandez Andres | $135,000 | Equity Title Agency Inc |
Source: Public Records
Mortgage History
| Date | Status | Borrower | Loan Amount |
|---|---|---|---|
| Open | Schelin Michael | $105,600 | |
| Previous Owner | Hernandez Andres | $133,119 | |
| Closed | Schelin Michael | $26,400 |
Source: Public Records
Tax History Compared to Growth
Tax History
| Year | Tax Paid | Tax Assessment Tax Assessment Total Assessment is a certain percentage of the fair market value that is determined by local assessors to be the total taxable value of land and additions on the property. | Land | Improvement |
|---|---|---|---|---|
| 2025 | $1,764 | $20,731 | -- | -- |
| 2024 | $1,782 | $19,744 | -- | -- |
| 2023 | $1,782 | $39,320 | $7,860 | $31,460 |
| 2022 | $1,744 | $30,760 | $6,150 | $24,610 |
| 2021 | $1,784 | $28,410 | $5,680 | $22,730 |
| 2020 | $1,759 | $24,670 | $4,930 | $19,740 |
| 2019 | $1,632 | $21,220 | $4,240 | $16,980 |
| 2018 | $1,557 | $19,910 | $3,980 | $15,930 |
| 2017 | $1,202 | $15,610 | $3,120 | $12,490 |
| 2016 | $1,179 | $15,570 | $3,110 | $12,460 |
| 2015 | $1,111 | $12,720 | $2,540 | $10,180 |
Source: Public Records
Map
Nearby Homes
- 5309 E Carmel Ave
- 5142 E Edgewood Cir
- 5225 E Enid Ave Unit 110
- 428 S Sunnyvale
- 5057 E Dragoon Ave
- 5122 E Emerald Cir
- 2268 Leisure World
- 5109 E Enid Ave
- 2212 Leisure World
- 2445 Leisure World
- 542 S Higley Rd Unit 52
- 542 S Higley Rd Unit 49
- 542 S Higley Rd Unit 3
- 2151 Leisure World
- 636 S Rosemont
- 5718 E Flower Cir
- 2461 Leisure World
- 5215 E Southern Ave
- 205 S Higley Rd Unit 236
- 205 S Higley Rd Unit 156
- 731 S 54th St
- 747 S 54th St
- 5409 E Diamond Cir
- 5408 E Diamond Cir
- 5351 E Diamond Ave
- 755 S 54th St
- 5366 E Delta Ave
- 723 S 54th St
- 5352 E Diamond Ave
- 5410 E Delta Ave Unit 2
- 5417 E Diamond Cir
- 5350 E Delta Ave
- 5416 E Diamond Cir
- 5407 E Dolphin Cir
- 5343 E Diamond Ave
- 5344 E Diamond Ave
- 5353 E Dolphin Ave
- 5418 E Delta Ave
- 848 S 54th St
- 715 S 54th St