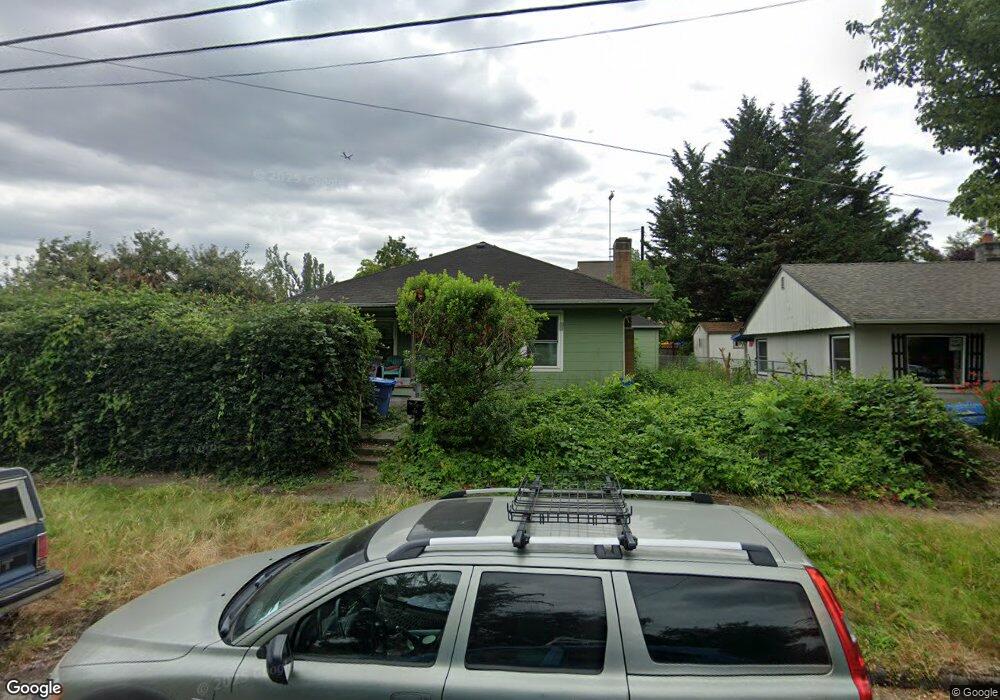
739 S Rose St Seattle, WA 98108
South Park NeighborhoodEstimated Value: $616,000 - $672,000
3
Beds
1
Bath
1,400
Sq Ft
$465/Sq Ft
Est. Value
About This Home
This home is located at 739 S Rose St, Seattle, WA 98108 and is currently estimated at $650,376, approximately $464 per square foot. 739 S Rose St is a home located in King County with nearby schools including Concord International Elementary School, Denny Middle School, and Chief Sealth High School.
Ownership History
Date
Name
Owned For
Owner Type
Purchase Details
Closed on
Dec 31, 2024
Sold by
Strong Charles B and Strong Michael C
Bought by
Strong Michael C and Wooden Leeanne D
Current Estimated Value
Home Financials for this Owner
Home Financials are based on the most recent Mortgage that was taken out on this home.
Original Mortgage
$607,050
Outstanding Balance
$602,859
Interest Rate
6.84%
Mortgage Type
New Conventional
Estimated Equity
$47,517
Purchase Details
Closed on
Jan 24, 2018
Sold by
Strong Charles B
Bought by
Strong Charles B and Strong Michael C
Purchase Details
Closed on
Aug 9, 1982
Sold by
Walker Linda M
Bought by
Strong Richard M
Create a Home Valuation Report for This Property
The Home Valuation Report is an in-depth analysis detailing your home's value as well as a comparison with similar homes in the area
Home Values in the Area
Average Home Value in this Area
Purchase History
| Date | Buyer | Sale Price | Title Company |
|---|---|---|---|
| Strong Michael C | $639,000 | Ticor Title | |
| Strong Michael C | $639,000 | Ticor Title | |
| Strong Michael C | $639,000 | Ticor Title | |
| Strong Charles B | -- | None Available | |
| Strong Richard M | $13,000 | -- |
Source: Public Records
Mortgage History
| Date | Status | Borrower | Loan Amount |
|---|---|---|---|
| Open | Strong Michael C | $607,050 | |
| Closed | Strong Michael C | $607,050 |
Source: Public Records
Tax History Compared to Growth
Tax History
| Year | Tax Paid | Tax Assessment Tax Assessment Total Assessment is a certain percentage of the fair market value that is determined by local assessors to be the total taxable value of land and additions on the property. | Land | Improvement |
|---|---|---|---|---|
| 2024 | $6,798 | $614,000 | $432,000 | $182,000 |
| 2023 | $6,183 | $562,000 | $382,000 | $180,000 |
| 2022 | $4,956 | $590,000 | $348,000 | $242,000 |
| 2021 | $4,694 | $451,000 | $279,000 | $172,000 |
| 2020 | $4,515 | $407,000 | $247,000 | $160,000 |
| 2018 | $3,908 | $406,000 | $252,000 | $154,000 |
| 2017 | $3,383 | $333,000 | $211,000 | $122,000 |
| 2016 | $3,289 | $295,000 | $198,000 | $97,000 |
| 2015 | $2,911 | $284,000 | $194,000 | $90,000 |
| 2014 | -- | $256,000 | $174,000 | $82,000 |
| 2013 | -- | $239,000 | $174,000 | $65,000 |
Source: Public Records
Map
Nearby Homes
- 817 C S Rose St
- 815 S Rose St Unit A
- 749 S Elmgrove St
- 818 A S Sullivan St
- 820 B S Sullivan St
- 822 B S Sullivan St
- 818 B S Sullivan St
- 8504 8th Ave S
- 547 S Sullivan St
- 551 S Sullivan St
- 8517 7th Ave S
- 833 S Cloverdale St Unit A
- 533 S Cloverdale St Unit C
- 527 S Cloverdale St Unit D
- 8723 7th Ave S
- 826 S Trenton St
- 8333 Dallas Ave S
- 1211 S Trenton St
- 711 S Trenton St
- 846 S Trenton St
- 749 S Rose St
- 731 S Rose St
- 727 S Rose St
- 8307 8th Ave S
- 8301 8th Ave S
- 742 S Rose St
- 738 S Rose St
- 721 S Rose St
- 750 S Rose St
- 730 S Rose St
- 754 S Rose St
- 717 S Rose St
- 724 S Rose St
- 8215 8th Ave S
- 720 S Rose St
- 711 S Rose St
- 729 S Southern St
- 8302 8th Ave S
- 737 S Southern St
- 733 S Southern St Unit A