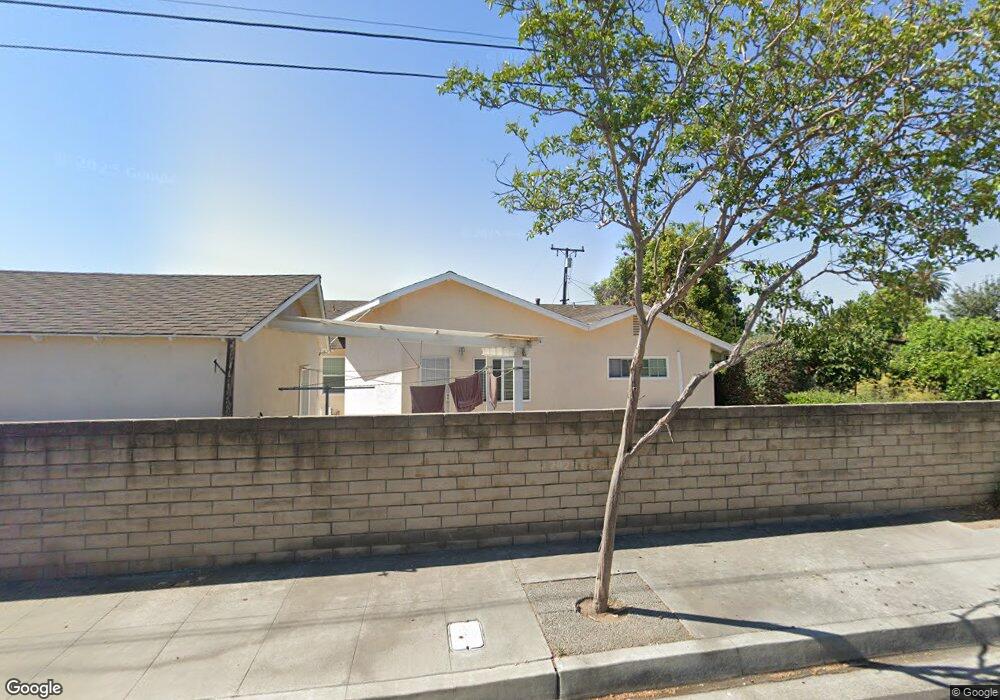
739 W Lemon Ave Unit A Arcadia, CA 91007
Estimated Value: $1,005,000 - $1,330,000
4
Beds
2
Baths
1,617
Sq Ft
$739/Sq Ft
Est. Value
About This Home
This home is located at 739 W Lemon Ave Unit A, Arcadia, CA 91007 and is currently estimated at $1,195,690, approximately $739 per square foot. 739 W Lemon Ave Unit A is a home located in Los Angeles County with nearby schools including Longden Elementary School, Oak Avenue Intermediate School, and Temple City High School.
Ownership History
Date
Name
Owned For
Owner Type
Purchase Details
Closed on
Aug 24, 2025
Sold by
Ma Linda
Bought by
Linda Ma Living Trust and Ma
Current Estimated Value
Purchase Details
Closed on
Dec 24, 2019
Sold by
Du Lee
Bought by
Ma Chunlin
Purchase Details
Closed on
Aug 22, 2018
Sold by
Du Leo and Ma Chulin
Bought by
Du Leo and Ma Chunlin
Home Financials for this Owner
Home Financials are based on the most recent Mortgage that was taken out on this home.
Original Mortgage
$360,000
Interest Rate
4.87%
Mortgage Type
Adjustable Rate Mortgage/ARM
Purchase Details
Closed on
Apr 16, 2007
Sold by
Prokop Thomas and The Marguerite M Prokop 1990 T
Bought by
Du Yubing
Home Financials for this Owner
Home Financials are based on the most recent Mortgage that was taken out on this home.
Original Mortgage
$230,000
Interest Rate
6.11%
Mortgage Type
Purchase Money Mortgage
Create a Home Valuation Report for This Property
The Home Valuation Report is an in-depth analysis detailing your home's value as well as a comparison with similar homes in the area
Home Values in the Area
Average Home Value in this Area
Purchase History
We collect this data history from publicly available records. To have your information removed, we recommend requesting removal directly through your county’s website.
| Date | Buyer | Sale Price | Title Company |
|---|---|---|---|
| Linda Ma Living Trust | -- | None Listed On Document | |
| Ma Linda | -- | None Listed On Document | |
| Ma Chunlin | -- | None Available | |
| Du Leo | -- | Fidelity National Title Sher | |
| Du Yubing | $550,000 | Orange Coast Title |
Source: Public Records
Mortgage History
We collect this data history from publicly available records. To have your information removed, we recommend requesting removal directly through your county’s website.
| Date | Status | Borrower | Loan Amount |
|---|---|---|---|
| Previous Owner | Du Leo | $360,000 | |
| Previous Owner | Du Yubing | $230,000 |
Source: Public Records
Tax History
| Year | Tax Paid | Tax Assessment Tax Assessment Total Assessment is a certain percentage of the fair market value that is determined by local assessors to be the total taxable value of land and additions on the property. | Land | Improvement |
|---|---|---|---|---|
| 2025 | $9,090 | $767,737 | $589,501 | $178,236 |
| 2024 | $8,939 | $752,685 | $577,943 | $174,742 |
| 2023 | $8,744 | $737,927 | $566,611 | $171,316 |
| 2022 | $8,167 | $723,458 | $555,501 | $167,957 |
| 2021 | $8,327 | $709,273 | $544,609 | $164,664 |
| 2020 | $8,210 | $702,001 | $539,025 | $162,976 |
| 2019 | $8,025 | $688,237 | $528,456 | $159,781 |
| 2018 | $7,824 | $674,744 | $518,095 | $156,649 |
| 2016 | $7,499 | $648,545 | $497,978 | $150,567 |
| 2015 | $7,368 | $638,804 | $490,498 | $148,306 |
| 2014 | $7,265 | $626,291 | $480,890 | $145,401 |
Source: Public Records
Map
Nearby Homes
- 662 W Norman Ave
- 1522 S Baldwin Ave Unit 10
- 6421 Golden West Ave
- 6718 N Golden West Ave
- 639 W Longden Ave
- 631 W Longden Ave
- 9626 Ancourt St
- 536 W Camino Real Ave
- 9656 Ardendale Ave
- 1231 S Golden Ave W Unit 11
- 1231 S Golden West Ave Unit 3
- 1211 S Golden West Ave Unit C
- 905 W Duarte Rd Unit A
- 750 Arcadia Ave Unit 7
- 9959 Garibaldi Ave
- 423 W Lemon Ave
- 1222 Temple City Blvd
- 9821 Garibaldi Ave
- 411 W Norman Ave
- 444 W Naomi Ave
- 739 W Lemon Ave
- 735 W Lemon Ave
- 733 W Lemon Ave
- 728 Sharon Rd
- 747 W Lemon Ave
- 743 Sharon Rd
- 733 Sharon Rd
- 737 Sharon Rd
- 729 Sharon Rd
- 9857 E Lemon Ave
- 737 W Lemon Ave
- 9859 E Lemon Ave
- 745 W Lemon Ave
- 731 W Lemon Ave
- 9860 Emperor Ave
- 727 W Lemon Ave
- 721 W Lemon Ave
- 723 Sharon Rd
- 9855 E Lemon Ave
- 9854 Emperor Ave
Your Personal Tour Guide
Ask me questions while you tour the home.