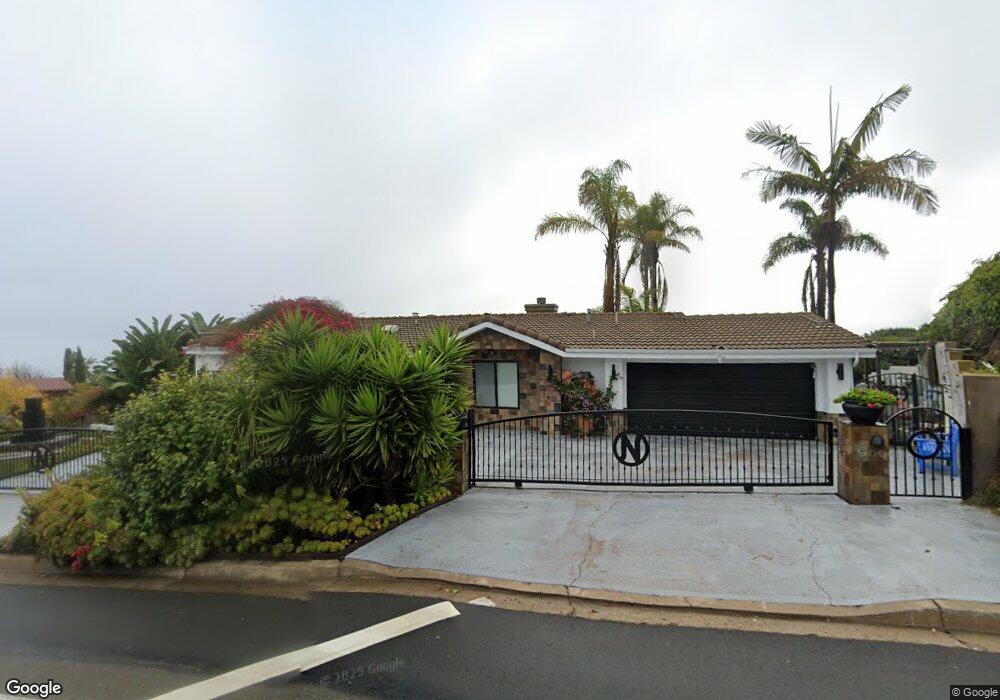
7391 Via Capri La Jolla, CA 92037
Hidden Valley NeighborhoodEstimated Value: $5,460,000 - $5,966,000
4
Beds
5
Baths
4,238
Sq Ft
$1,334/Sq Ft
Est. Value
About This Home
This home is located at 7391 Via Capri, La Jolla, CA 92037 and is currently estimated at $5,654,938, approximately $1,334 per square foot. 7391 Via Capri is a home located in San Diego County with nearby schools including La Jolla Elementary School, Muirlands Middle School, and La Jolla High School.
Ownership History
Date
Name
Owned For
Owner Type
Purchase Details
Closed on
Nov 6, 2024
Sold by
Arezo Trust and Arbabi Mohammad B
Bought by
Sunflower Trust and Arbabi
Current Estimated Value
Purchase Details
Closed on
Nov 23, 2020
Sold by
Arbabi Mohammad B and Arbabi Azadeh
Bought by
Arbabi Mohammad B and Arbabi Azadeh
Purchase Details
Closed on
Jan 19, 2010
Sold by
Nguyen Tan The and Dang Elizabeth Thuy
Bought by
Arbabi Mohammad B and Arbabi Azadeh
Home Financials for this Owner
Home Financials are based on the most recent Mortgage that was taken out on this home.
Original Mortgage
$253,000
Interest Rate
5%
Mortgage Type
Stand Alone Second
Purchase Details
Closed on
Nov 12, 2008
Sold by
Nguyen Tan T and Nguyen Elizabeth
Bought by
Nguyen Tan The and Dang Elizabeth Thuy
Purchase Details
Closed on
Nov 6, 2003
Sold by
The United States Of America
Bought by
Nguyen Tan T and Nguyen Elizabeth
Home Financials for this Owner
Home Financials are based on the most recent Mortgage that was taken out on this home.
Original Mortgage
$1,090,000
Interest Rate
7.25%
Mortgage Type
Purchase Money Mortgage
Purchase Details
Closed on
Aug 4, 2003
Sold by
Ring Suk Hi
Bought by
The United States Of America
Purchase Details
Closed on
Dec 28, 2000
Sold by
Ring Suk Hi and Yi Mee Young
Bought by
Ring Suk Hi
Home Financials for this Owner
Home Financials are based on the most recent Mortgage that was taken out on this home.
Original Mortgage
$500,000
Interest Rate
7.36%
Purchase Details
Closed on
Nov 15, 1999
Sold by
Ring Suk Hi
Bought by
Ring Suk Hi and Yi Mee Young
Home Financials for this Owner
Home Financials are based on the most recent Mortgage that was taken out on this home.
Original Mortgage
$690,000
Interest Rate
3.45%
Purchase Details
Closed on
Sep 22, 1999
Sold by
Micare Pascal D
Bought by
Ring Suk Hi
Home Financials for this Owner
Home Financials are based on the most recent Mortgage that was taken out on this home.
Original Mortgage
$690,000
Interest Rate
3.45%
Purchase Details
Closed on
May 22, 1996
Sold by
Micare Pascal D and Shen Yuan
Bought by
Micare Pascal D
Purchase Details
Closed on
Mar 9, 1994
Sold by
Harlow James M and Harlow Carol S
Bought by
Micare Pascal D and Shen Yuan
Home Financials for this Owner
Home Financials are based on the most recent Mortgage that was taken out on this home.
Original Mortgage
$412,000
Interest Rate
5%
Create a Home Valuation Report for This Property
The Home Valuation Report is an in-depth analysis detailing your home's value as well as a comparison with similar homes in the area
Home Values in the Area
Average Home Value in this Area
Purchase History
| Date | Buyer | Sale Price | Title Company |
|---|---|---|---|
| Sunflower Trust | -- | None Listed On Document | |
| Sunflower Trust | -- | None Listed On Document | |
| Arbabi Mohammad B | -- | None Available | |
| Arbabi Mohammad B | $2,780,000 | Corinthian Title Company | |
| Nguyen Tan The | -- | None Available | |
| Nguyen Tan T | $1,550,000 | North American Title Co | |
| The United States Of America | -- | -- | |
| Ring Suk Hi | -- | Lawyers Title | |
| Ring Suk Hi | -- | -- | |
| Ring Suk Hi | $1,150,000 | Chicago Title Co | |
| Micare Pascal D | -- | -- | |
| Micare Pascal D | $515,000 | First American Title Ins Co |
Source: Public Records
Mortgage History
| Date | Status | Borrower | Loan Amount |
|---|---|---|---|
| Previous Owner | Arbabi Mohammad B | $253,000 | |
| Previous Owner | Arbabi Mohammad B | $417,000 | |
| Previous Owner | Nguyen Tan T | $1,090,000 | |
| Previous Owner | Ring Suk Hi | $500,000 | |
| Previous Owner | Ring Suk Hi | $690,000 | |
| Previous Owner | Micare Pascal D | $412,000 | |
| Closed | Ring Suk Hi | $400,000 |
Source: Public Records
Tax History Compared to Growth
Tax History
| Year | Tax Paid | Tax Assessment Tax Assessment Total Assessment is a certain percentage of the fair market value that is determined by local assessors to be the total taxable value of land and additions on the property. | Land | Improvement |
|---|---|---|---|---|
| 2025 | $43,151 | $3,588,300 | $2,323,361 | $1,264,939 |
| 2024 | $43,151 | $3,517,942 | $2,277,805 | $1,240,137 |
| 2023 | $42,201 | $3,448,964 | $2,233,143 | $1,215,821 |
| 2022 | $41,077 | $3,381,338 | $2,189,356 | $1,191,982 |
| 2021 | $40,794 | $3,315,038 | $2,146,428 | $1,168,610 |
| 2020 | $35,612 | $2,900,000 | $1,783,000 | $1,117,000 |
| 2019 | $34,442 | $2,800,000 | $1,722,000 | $1,078,000 |
| 2018 | $32,839 | $2,800,000 | $1,722,000 | $1,078,000 |
| 2017 | $80 | $2,675,000 | $1,646,000 | $1,029,000 |
| 2016 | $31,360 | $2,675,000 | $1,646,000 | $1,029,000 |
| 2015 | $29,899 | $2,550,000 | $1,570,000 | $980,000 |
| 2014 | $30,029 | $2,550,000 | $1,570,000 | $980,000 |
Source: Public Records
Map
Nearby Homes
- 2365 Via Siena
- 7530 Hillside Dr
- 7202 Via Capri
- 7455 Hillside Dr
- 1904 Via Casa Alta
- 2082 Via Casa Alta
- 7612 Hillside Dr
- 7713 Esterel Dr
- 6815 La Jolla Scenic Dr S
- 7716 Lookout Dr
- 7981 Caminito Del Cid
- 7232 Romero Dr
- 7138 Romero Dr Unit 3
- 7138 Romero Dr Unit Lot 3
- 7940 La Jolla Shores Dr
- 2500 Torrey Pines Rd Unit 305
- 2500 Torrey Pines Rd Unit 902
- 2500 Torrey Pines Rd Unit 805
- 2510 Torrey Pines Unit 212
- 7151 Romero Dr Unit 1
- 2425 Via Siena
- 7381 Rue Michael
- 2422 Via Siena
- 7371 Rue Michael
- 2404 Via Siena
- 2501 Via Viesta
- 7378 Via Capri
- 7390 Via Capri
- 7361 Rue Michael
- 2461 Via Viesta
- 7364 Via Capri
- 2511 Via Viesta
- 7382 Rue Michael
- 7421 Via Capri
- 7370 Rue Michael
- 7351 Rue Michael
- 2342 Rue de Anne
- 2356 Rue de Anne
- 2490 Via Viesta
- 7356 Rue Michael