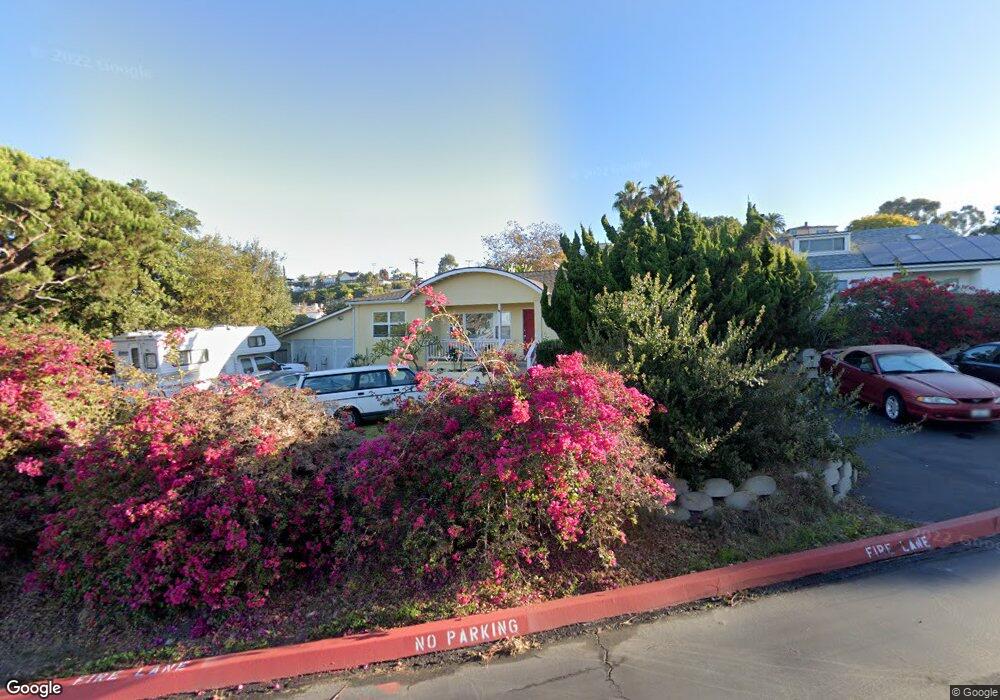
7397 High Ave La Jolla, CA 92037
The Village NeighborhoodEstimated Value: $2,214,000 - $3,230,000
4
Beds
3
Baths
1,778
Sq Ft
$1,513/Sq Ft
Est. Value
About This Home
This home is located at 7397 High Ave, La Jolla, CA 92037 and is currently estimated at $2,689,601, approximately $1,512 per square foot. 7397 High Ave is a home located in San Diego County with nearby schools including La Jolla Elementary School, Muirlands Middle School, and La Jolla High School.
Ownership History
Date
Name
Owned For
Owner Type
Purchase Details
Closed on
Jun 16, 2014
Sold by
Andrews Richard Allen and Russo Mary Beth
Bought by
The Andrews Revocable Trust
Current Estimated Value
Purchase Details
Closed on
Jan 26, 2000
Sold by
Carver Fern Trust 05-03-90 and Fern
Bought by
The Marsha Best Trust
Create a Home Valuation Report for This Property
The Home Valuation Report is an in-depth analysis detailing your home's value as well as a comparison with similar homes in the area
Home Values in the Area
Average Home Value in this Area
Purchase History
| Date | Buyer | Sale Price | Title Company |
|---|---|---|---|
| The Andrews Revocable Trust | -- | None Available | |
| Andrews Richard Allen | -- | None Available | |
| The Marsha Best Trust | -- | -- |
Source: Public Records
Tax History
| Year | Tax Paid | Tax Assessment Tax Assessment Total Assessment is a certain percentage of the fair market value that is determined by local assessors to be the total taxable value of land and additions on the property. | Land | Improvement |
|---|---|---|---|---|
| 2025 | $14,000 | $1,167,024 | $960,241 | $206,783 |
| 2024 | $14,000 | $1,144,142 | $941,413 | $202,729 |
| 2023 | $13,690 | $1,121,708 | $922,954 | $198,754 |
| 2022 | $13,324 | $1,099,714 | $904,857 | $194,857 |
| 2021 | $13,231 | $1,078,152 | $887,115 | $191,037 |
| 2020 | $13,070 | $1,067,098 | $878,019 | $189,079 |
| 2019 | $12,835 | $1,046,175 | $860,803 | $185,372 |
| 2018 | $11,998 | $1,025,663 | $843,925 | $181,738 |
| 2017 | $11,711 | $1,005,553 | $827,378 | $178,175 |
| 2016 | $11,524 | $985,837 | $811,155 | $174,682 |
| 2015 | $11,353 | $971,030 | $798,971 | $172,059 |
| 2014 | $11,172 | $952,010 | $783,321 | $168,689 |
Source: Public Records
Map
Nearby Homes
- 7447 Herschel Ave
- 1221 Virginia Way
- 1138 Virginia Way
- 7376 Fay Ave
- 1420 La Jolla Knoll
- 7550 Eads Ave Unit 307
- 7651 Country Club Dr
- 7560 Eads Ave Unit 12
- 7509 Draper Ave Unit 306
- 7520 Draper Ave Unit 3
- 1586 Crespo Dr
- 7319 Cuvier St
- 7421-25 La Jolla Blvd
- 7441-43 La Jolla Blvd
- 7817 Exchange Place Unit 23
- 7811 Eads Ave Unit 206
- 7811 Eads Ave Unit 311
- 1641 Crespo Dr
- 607 Arenas St
- 1642 Valdes Dr
- 7405 High Ave
- 7389 High Ave
- 7390 Cabrillo Ave
- 7415 High Ave
- 7404 Cabrillo Ave
- 7370 Cabrillo Ave
- 7425 High Ave
- 7416 Cabrillo Ave
- 7402 High Ave
- 7412 High Ave
- 7433 High Ave
- 7420 High Ave
- 7430 Cabrillo Ave Unit 32
- 7428 High Ave
- 7437 High Ave Unit 43
- 7430 High Ave
- 1251 Rhoda Dr
- 7427 Cabrillo Ave
- 7434 High Ave
- 7427 Cabrillo Avenue Plus House
Your Personal Tour Guide
Ask me questions while you tour the home.