Estimated Value: $566,000 - $697,000
3
Beds
3
Baths
1,886
Sq Ft
$347/Sq Ft
Est. Value
About This Home
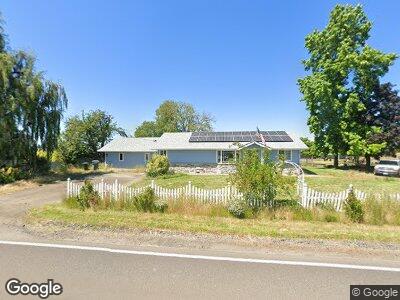
This home is located at 7399 S Lone Elder Rd, Canby, OR 97013 and is currently estimated at $654,424, approximately $346 per square foot. 7399 S Lone Elder Rd is a home located in Clackamas County with nearby schools including Philander Lee Elementary School, Baker Prairie Middle School, and Canby High School.
Ownership History
Date
Name
Owned For
Owner Type
Purchase Details
Closed on
Dec 28, 2020
Sold by
Chase Brandon Edward and Chase Danelle Joy
Bought by
Chase Brandon Edward and Chase Denelle Joy
Current Estimated Value
Home Financials for this Owner
Home Financials are based on the most recent Mortgage that was taken out on this home.
Original Mortgage
$260,000
Outstanding Balance
$234,166
Interest Rate
2.71%
Mortgage Type
New Conventional
Estimated Equity
$420,258
Purchase Details
Closed on
May 11, 2018
Sold by
Chase Brandon E and Chase Danelle J
Bought by
Chase Brandon Edward and Chase Danelle Joy
Purchase Details
Closed on
Jun 23, 2014
Sold by
Mccormick Paul J and Mccormick Kendra K
Bought by
Chase Brandon E and Chase Danelle J
Home Financials for this Owner
Home Financials are based on the most recent Mortgage that was taken out on this home.
Original Mortgage
$297,618
Interest Rate
3.75%
Mortgage Type
FHA
Create a Home Valuation Report for This Property
The Home Valuation Report is an in-depth analysis detailing your home's value as well as a comparison with similar homes in the area
Home Values in the Area
Average Home Value in this Area
Purchase History
| Date | Buyer | Sale Price | Title Company |
|---|---|---|---|
| Chase Brandon Edward | -- | Chicago Title | |
| Chase Brandon Edward | -- | None Available | |
| Chase Brandon E | $325,000 | Chicago Title |
Source: Public Records
Mortgage History
| Date | Status | Borrower | Loan Amount |
|---|---|---|---|
| Open | Chase Brandon Edward | $178,000 | |
| Open | Chase Brandon Edward | $260,000 | |
| Closed | Chase Brandon E | $287,500 | |
| Closed | Chase Brandon E | $296,176 | |
| Closed | Chase Brandon E | $297,618 | |
| Previous Owner | Mccormick Paul J | $315,000 | |
| Previous Owner | Mccormick Paul J | $125,000 |
Source: Public Records
Tax History Compared to Growth
Tax History
| Year | Tax Paid | Tax Assessment Tax Assessment Total Assessment is a certain percentage of the fair market value that is determined by local assessors to be the total taxable value of land and additions on the property. | Land | Improvement |
|---|---|---|---|---|
| 2023 | $4,143 | $280,686 | $0 | $0 |
| 2022 | $3,788 | $272,511 | $0 | $0 |
| 2021 | $3,641 | $264,574 | $0 | $0 |
| 2020 | $3,586 | $256,868 | $0 | $0 |
| 2019 | $3,398 | $249,387 | $0 | $0 |
| 2018 | $3,328 | $242,123 | $0 | $0 |
| 2017 | $3,045 | $220,474 | $0 | $0 |
| 2016 | $2,940 | $214,052 | $0 | $0 |
| 2015 | $2,836 | $207,817 | $0 | $0 |
| 2014 | $2,754 | $201,764 | $0 | $0 |
Source: Public Records
Map
Nearby Homes
- 26026 S Meridian Rd
- 8381 S Vale Garden Rd
- 26260 S Laurel Rd
- 1655 S Elm St Unit 331
- 1655 S Elm St Unit 304
- 1655 S Elm St Unit 531
- 1655 S Elm St Unit 408
- 208 SW 19th Ave
- 438 SW 16th Ave
- 215 SW 18th Ave
- 1189 S Aspen Way
- 1400 S Elm St Unit 45
- 1400 S Elm St Unit 81
- 1400 S Elm St Unit 76
- 1400 S Elm St Unit 91
- 26275 S Highway 170
- 15109 2nd St NE
- 21130 S Peach Rd
- 835 S Elm Ct
- 201 SE 16th Ave
- 7391 S Lone Elder Rd
- 7399 S Lone Elder Rd
- 7200 S Lone Elder Rd
- 7770 S Lone Elder Rd
- 7285 S Lone Elder Rd
- 26181 S Barlow Rd
- 26310 S Barlow Rd
- 7741 S Lone Elder Rd
- 7475 S Mark Rd
- 6799 S Lone Elder Rd
- 26510 S Barlow Rd
- 7285 S Seven Oaks Ln
- 25571 S Barlow Rd
- 25541 S Barlow Rd
- 25460 S Barlow Rd Unit 1
- 25460 S Barlow Rd
- 7187 S Seven Oaks Ln
- 7253 S Seven Oaks Ln
- 7215 S Seven Oaks Ln
- 6711 S Lone Elder Rd