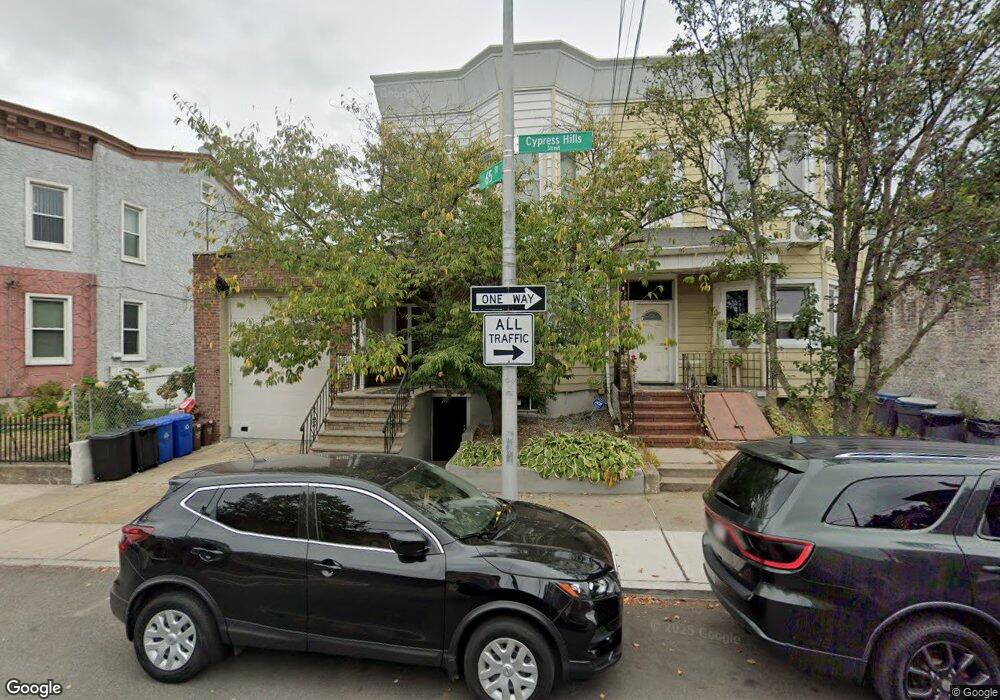
74-11 Cypress Hills St Unit 2 Flushing, NY 11385
Glendale NeighborhoodEstimated Value: $871,000 - $1,050,000
1
Bed
--
Bath
1,764
Sq Ft
$538/Sq Ft
Est. Value
About This Home
This home is located at 74-11 Cypress Hills St Unit 2, Flushing, NY 11385 and is currently estimated at $949,524, approximately $538 per square foot. 74-11 Cypress Hills St Unit 2 is a home located in Queens County with nearby schools including P.S. 91 - Richard Arkwright, I.S. 119 the Glendale, and Elm Community Charter School.
Ownership History
Date
Name
Owned For
Owner Type
Purchase Details
Closed on
Dec 23, 2013
Sold by
Dicandio Frank J and Dicandio Frank John
Bought by
Dicandio Frank J and Vetter Jamie M
Current Estimated Value
Home Financials for this Owner
Home Financials are based on the most recent Mortgage that was taken out on this home.
Original Mortgage
$444,000
Outstanding Balance
$334,975
Interest Rate
4.45%
Mortgage Type
New Conventional
Estimated Equity
$614,549
Purchase Details
Closed on
Sep 9, 2008
Sold by
Estate Of Francisco L Dicandio and Angela Zerga %
Bought by
Dicandio Frank John
Home Financials for this Owner
Home Financials are based on the most recent Mortgage that was taken out on this home.
Original Mortgage
$420,000
Interest Rate
6.57%
Create a Home Valuation Report for This Property
The Home Valuation Report is an in-depth analysis detailing your home's value as well as a comparison with similar homes in the area
Home Values in the Area
Average Home Value in this Area
Purchase History
| Date | Buyer | Sale Price | Title Company |
|---|---|---|---|
| Dicandio Frank J | -- | -- | |
| Dicandio Frank J | -- | -- | |
| Dicandio Frank John | $570,000 | -- | |
| Dicandio Frank John | $570,000 | -- |
Source: Public Records
Mortgage History
| Date | Status | Borrower | Loan Amount |
|---|---|---|---|
| Open | Dicandio Frank J | $444,000 | |
| Closed | Dicandio Frank J | $444,000 | |
| Previous Owner | Dicandio Frank John | $420,000 |
Source: Public Records
Tax History Compared to Growth
Tax History
| Year | Tax Paid | Tax Assessment Tax Assessment Total Assessment is a certain percentage of the fair market value that is determined by local assessors to be the total taxable value of land and additions on the property. | Land | Improvement |
|---|---|---|---|---|
| 2025 | $7,663 | $41,803 | $12,037 | $29,766 |
| 2024 | $7,675 | $39,554 | $11,597 | $27,957 |
| 2023 | $7,231 | $37,404 | $11,683 | $25,721 |
| 2022 | $6,837 | $48,540 | $15,480 | $33,060 |
| 2021 | $7,035 | $46,500 | $15,480 | $31,020 |
| 2020 | $7,078 | $51,120 | $15,480 | $35,640 |
| 2019 | $6,602 | $49,920 | $15,480 | $34,440 |
| 2018 | $6,056 | $31,170 | $9,036 | $22,134 |
| 2017 | $5,762 | $29,738 | $10,867 | $18,871 |
| 2016 | $5,494 | $29,738 | $10,867 | $18,871 |
| 2015 | $3,164 | $29,030 | $15,946 | $13,084 |
| 2014 | $3,164 | $27,469 | $15,821 | $11,648 |
Source: Public Records
Map
Nearby Homes
- 7402 65th St
- 74-40 65th St
- 74-33 65th St
- 73-30 72 St
- 65 Cooper Square Unit 3A
- 65 Cooper Square Unit 3B
- 7520 64th Place
- 67-03 Myrtle Ave
- 647 Cooper Ave
- 70-30 65th Place
- 7447 62nd St
- 7818 65th St
- 70-49 66th Place Unit 2 units
- 70-49 66th Place
- 71-51 67th Place
- 78-24 64th Ln
- 78-30 64th Ln
- 7830 64th Ln
- 75-16 62nd St
- 67 67th Place
- 7411 Cypress Hills St
- 7413 Cypress Hills St
- 7236 65th Place
- 7407 Cypress Hills St
- 7238 65th Place
- 7240 65th Place
- 7232 65th Place
- 7234 65th Place
- 7230 65th Place
- 7252 65th Place
- 7228 65th Place
- 74-21 65th St
- 7242 65th Place
- 7224 65th Place
- 7242 65th Place
- 74-01 Cypress Hills St
- 7401 Cypress Hills St
- 74-04 65th St
- 7222 65th Place
- 74-02 65th St