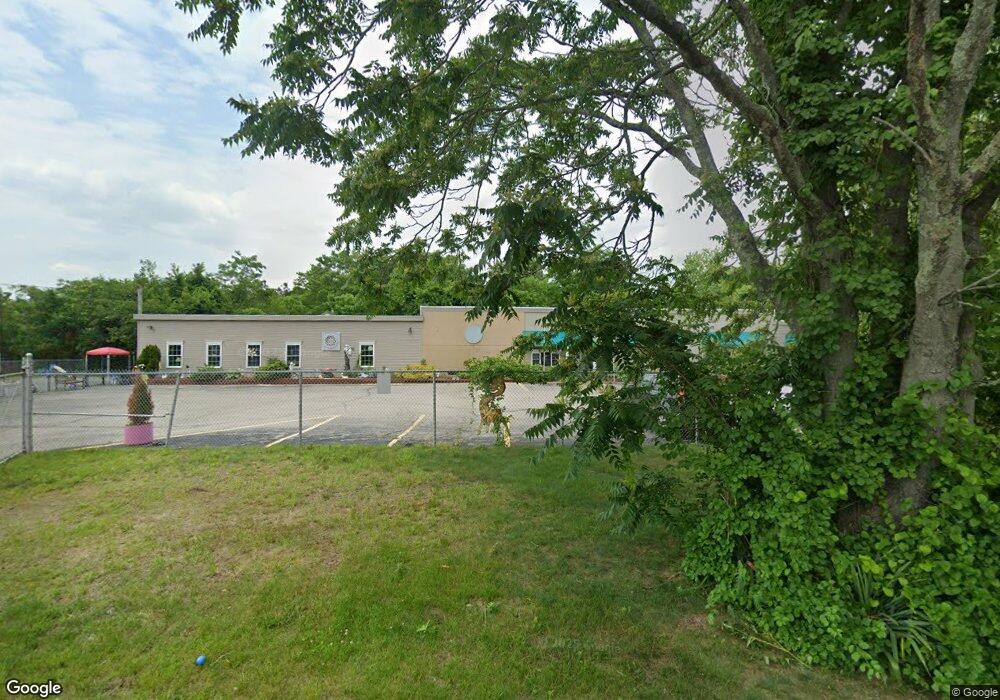
74 Alton St Cranston, RI 02910
Park View NeighborhoodEstimated Value: $455,105
--
Bed
--
Bath
4,684
Sq Ft
$97/Sq Ft
Est. Value
About This Home
This home is located at 74 Alton St, Cranston, RI 02910 and is currently priced at $455,105, approximately $97 per square foot. 74 Alton St is a home located in Providence County with nearby schools including Edgewood Highland Elementary School, Edward S. Rhodes School, and Park View Middle School.
Ownership History
Date
Name
Owned For
Owner Type
Purchase Details
Closed on
Jul 25, 2018
Sold by
Lutgarda & Maria Llc
Bought by
Airway Leasing Llc
Current Estimated Value
Purchase Details
Closed on
May 18, 2004
Sold by
Ondrasek Adele and Tiberi Paul
Bought by
Lutgarda & Maria Llc
Home Financials for this Owner
Home Financials are based on the most recent Mortgage that was taken out on this home.
Original Mortgage
$160,000
Interest Rate
5.47%
Mortgage Type
Commercial
Create a Home Valuation Report for This Property
The Home Valuation Report is an in-depth analysis detailing your home's value as well as a comparison with similar homes in the area
Home Values in the Area
Average Home Value in this Area
Purchase History
| Date | Buyer | Sale Price | Title Company |
|---|---|---|---|
| Airway Leasing Llc | $15,347 | -- | |
| Lutgarda & Maria Llc | $230,000 | -- |
Source: Public Records
Mortgage History
| Date | Status | Borrower | Loan Amount |
|---|---|---|---|
| Previous Owner | Lutgarda & Maria Llc | $75,000 | |
| Previous Owner | Lutgarda & Maria Llc | $270,000 | |
| Previous Owner | Lutgarda & Maria Llc | $160,000 |
Source: Public Records
Tax History Compared to Growth
Tax History
| Year | Tax Paid | Tax Assessment Tax Assessment Total Assessment is a certain percentage of the fair market value that is determined by local assessors to be the total taxable value of land and additions on the property. | Land | Improvement |
|---|---|---|---|---|
| 2025 | $10,443 | $501,600 | $199,900 | $301,700 |
| 2024 | $10,243 | $501,600 | $199,900 | $301,700 |
| 2023 | $12,276 | $433,000 | $171,300 | $261,700 |
| 2022 | $12,024 | $433,000 | $171,300 | $261,700 |
| 2021 | $11,691 | $433,000 | $171,300 | $261,700 |
| 2020 | $12,003 | $385,200 | $157,000 | $228,200 |
| 2019 | $12,003 | $385,200 | $157,000 | $228,200 |
| 2018 | $11,725 | $385,200 | $157,000 | $228,200 |
| 2017 | $12,615 | $366,600 | $142,800 | $223,800 |
| 2016 | $12,347 | $366,600 | $142,800 | $223,800 |
| 2015 | $12,347 | $366,600 | $142,800 | $223,800 |
| 2014 | $12,532 | $365,800 | $142,800 | $223,000 |
Source: Public Records
Map
Nearby Homes