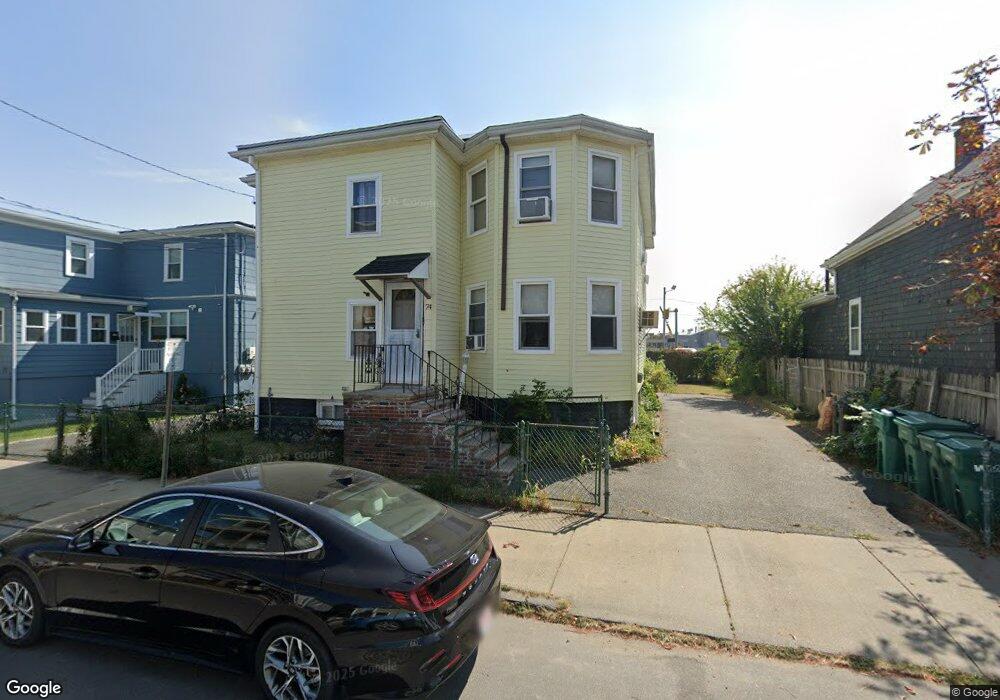
74 Camden St Lynn, MA 01905
West Lynn NeighborhoodEstimated Value: $652,069 - $794,000
4
Beds
2
Baths
2,148
Sq Ft
$337/Sq Ft
Est. Value
About This Home
This home is located at 74 Camden St, Lynn, MA 01905 and is currently estimated at $723,017, approximately $336 per square foot. 74 Camden St is a home located in Essex County with nearby schools including Drewicz Elementary School, William R. Fallon School, and Breed Middle School.
Ownership History
Date
Name
Owned For
Owner Type
Purchase Details
Closed on
Jul 1, 2022
Sold by
Calef Paul M
Bought by
Myette Jeanna M
Current Estimated Value
Home Financials for this Owner
Home Financials are based on the most recent Mortgage that was taken out on this home.
Original Mortgage
$423,750
Outstanding Balance
$402,553
Interest Rate
5.25%
Mortgage Type
Purchase Money Mortgage
Estimated Equity
$320,464
Purchase Details
Closed on
Mar 21, 2018
Sold by
Wetherell Robert E
Bought by
Calef Paul M and Wetherell Robert E
Home Financials for this Owner
Home Financials are based on the most recent Mortgage that was taken out on this home.
Original Mortgage
$303,469
Interest Rate
4.32%
Mortgage Type
FHA
Purchase Details
Closed on
May 23, 1994
Sold by
Wetherell Robert and Myette Richard
Bought by
Wetherell Robert and Wetherell Helen
Create a Home Valuation Report for This Property
The Home Valuation Report is an in-depth analysis detailing your home's value as well as a comparison with similar homes in the area
Home Values in the Area
Average Home Value in this Area
Purchase History
| Date | Buyer | Sale Price | Title Company |
|---|---|---|---|
| Myette Jeanna M | $565,000 | None Available | |
| Calef Paul M | -- | -- | |
| Calef Paul M | -- | -- | |
| Calef Paul M | -- | -- | |
| Wetherell Robert | $10,000 | -- | |
| Wetherell Robert | $10,000 | -- |
Source: Public Records
Mortgage History
| Date | Status | Borrower | Loan Amount |
|---|---|---|---|
| Open | Myette Jeanna M | $423,750 | |
| Previous Owner | Calef Paul M | $303,469 | |
| Previous Owner | Wetherell Robert | $25,000 |
Source: Public Records
Tax History
| Year | Tax Paid | Tax Assessment Tax Assessment Total Assessment is a certain percentage of the fair market value that is determined by local assessors to be the total taxable value of land and additions on the property. | Land | Improvement |
|---|---|---|---|---|
| 2025 | $6,417 | $619,387 | $200,600 | $418,787 |
| 2024 | $6,027 | $572,400 | $184,300 | $388,100 |
| 2023 | $5,860 | $525,600 | $164,200 | $361,400 |
| 2022 | $6,088 | $489,800 | $154,300 | $335,500 |
| 2021 | $5,563 | $426,900 | $127,300 | $299,600 |
| 2020 | $5,006 | $373,600 | $106,300 | $267,300 |
| 2019 | $4,746 | $331,900 | $91,300 | $240,600 |
| 2018 | $4,603 | $303,800 | $99,900 | $203,900 |
| 2017 | $4,122 | $264,200 | $88,300 | $175,900 |
| 2016 | $3,885 | $240,100 | $83,600 | $156,500 |
| 2015 | $3,551 | $212,000 | $72,000 | $140,000 |
Source: Public Records
Map
Nearby Homes
- 11 Margin St Unit 7
- 24 Hathaway St
- 6 Morris St
- 79 Laurel St
- 45 Cottage St Unit 3
- 44 Ballard St
- 95 Oakville St
- 20 Murray St
- 0 Hampton St
- 590 Boston St Unit 303
- 117 South St
- 21 Fenton Ave
- 78-80 Spencer St
- 73 Waterhill St
- 28 Wyman St
- 46 Wilfred St
- 101 Commercial St
- 70 Wyman St
- 50-50A Kirtland St
- 25 Piedmont Ave
Your Personal Tour Guide
Ask me questions while you tour the home.