Estimated Value: $935,000 - $2,214,399
5
Beds
4
Baths
2,856
Sq Ft
$551/Sq Ft
Est. Value
About This Home
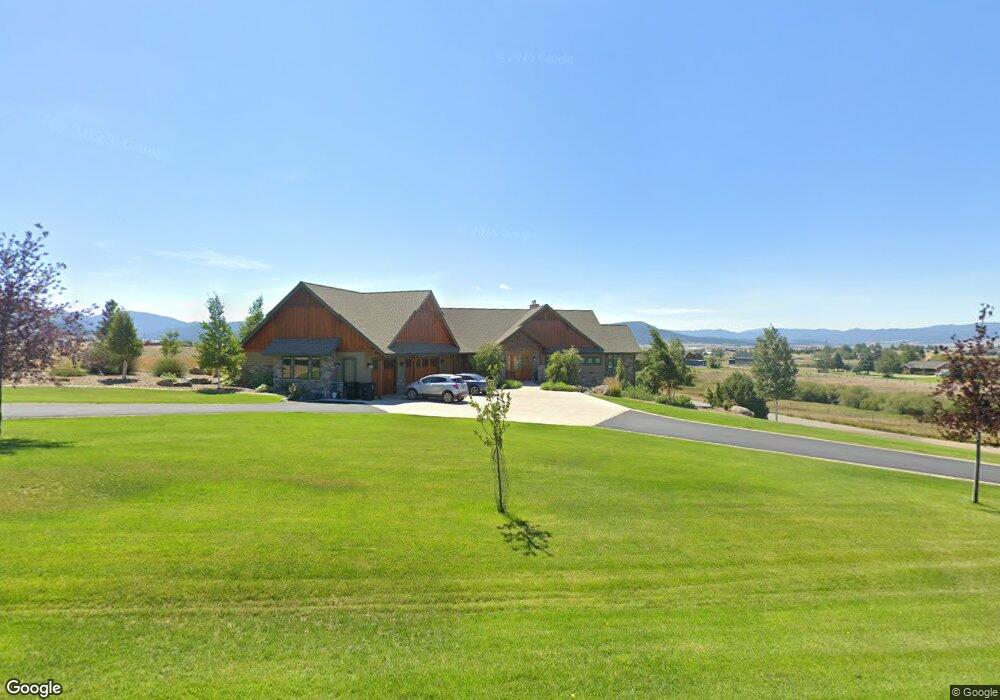
This home is located at 74 Coffee Ct, Butte, MT 59701 and is currently estimated at $1,574,700, approximately $551 per square foot. 74 Coffee Ct is a home with nearby schools including Hillcrest Elementary School, East Middle School, and Butte High School.
Ownership History
Date
Name
Owned For
Owner Type
Purchase Details
Closed on
Aug 15, 2025
Sold by
James C Gilman Family Irrevocable Trust and Chloe Gilman Family Irrevocable Trust
Bought by
Gilman James C and Gilman Christen C
Current Estimated Value
Purchase Details
Closed on
Dec 29, 2022
Sold by
James C Gilman Revocable Living Trust
Bought by
James C Gilman Family Irrevocable Trust and Chloe Gilman Family Irrevocable Trust
Purchase Details
Closed on
Aug 31, 2020
Sold by
Gilman James C
Bought by
Gilman James C and Chloe B Gilman Revocable Living Trust
Purchase Details
Closed on
Jan 29, 2015
Sold by
James C Gilman Revocable Living Trust
Bought by
Gilman James C and Gilman Chloe B
Purchase Details
Closed on
May 2, 2011
Sold by
J And C Gilman Family Limited Partnershi
Bought by
Gilman James C and Gilman Chloe B
Purchase Details
Closed on
Jul 23, 2009
Sold by
Fulton Alan and Fulton Linda
Bought by
Gilman Family Limited Partnership J And C
Create a Home Valuation Report for This Property
The Home Valuation Report is an in-depth analysis detailing your home's value as well as a comparison with similar homes in the area
Purchase History
| Date | Buyer | Sale Price | Title Company |
|---|---|---|---|
| Gilman James C | -- | None Listed On Document | |
| James C Gilman Family Irrevocable Trust | -- | -- | |
| Gilman James C | -- | None Available | |
| Gilman James C | -- | None Available | |
| Gilman James C | -- | -- | |
| Gilman Family Limited Partnership J And C | -- | -- |
Source: Public Records
Tax History
| Year | Tax Paid | Tax Assessment Tax Assessment Total Assessment is a certain percentage of the fair market value that is determined by local assessors to be the total taxable value of land and additions on the property. | Land | Improvement |
|---|---|---|---|---|
| 2025 | $19,148 | $2,022,136 | $0 | $0 |
| 2024 | $15,157 | $1,783,669 | $0 | $0 |
| 2023 | $15,251 | $1,783,669 | $0 | $0 |
| 2022 | $13,873 | $1,301,650 | $0 | $0 |
| 2021 | $14,422 | $1,301,650 | $0 | $0 |
| 2020 | $14,278 | $1,266,078 | $0 | $0 |
| 2019 | $14,352 | $1,266,078 | $0 | $0 |
| 2018 | $13,055 | $1,181,415 | $0 | $0 |
| 2017 | $11,987 | $1,181,415 | $0 | $0 |
| 2016 | $11,197 | $1,088,940 | $0 | $0 |
| 2015 | $11,017 | $1,044,750 | $0 | $0 |
| 2014 | $9,164 | $468,420 | $0 | $0 |
Source: Public Records
Map
Nearby Homes
- Tbd Continental Dr
- LOT 3 Tbd Stonecrop Rd
- LOT 4 Tbd Stonecrop Rd
- Mine Survey #7882 Tract 2 N
- 13 Bittersweet Dr
- 100 Cedar Lake Ct
- 104 Rocky Mountain Ln
- 105 Country Club Ln
- 3002 Meadowlark Ln
- 140 Shoestring Annie Rd
- TBD Porter Ave
- 4107 Trenton St
- 7270 Porter Ave
- 3440 Burlington St
- Parcel B Harrison Ave
- 4800 Harrison Ave Unit 19
- 4800 Harrison Ave Unit 16
- 4800 Harrison Ave Unit 17
- 125 Mountain View Rd
- 40 N Lake Dr
- TBD Coffee Ct
- 95 Coffee Ct
- 21 Coffee Ct
- 1184 Blacktail Loop
- 1125 Blacktail Loop
- 1173 Blacktail Loop
- Tbd Blacktail Loop
- Lot 1 Blacktail Loop
- 1075 Blacktail Loop
- 994 Rialto Way
- 5401 Continental Dr
- 5333 Continental Dr
- 1175 Blacktail Loop
- 5331 Continental Dr
- 1055 Blacktail Loop
- 1400 Blacktail Loop
- 955 Rialto Way
- 958 Rialto Way
- 1221 Blacktail Loop
- 5319 Continental Dr
Your Personal Tour Guide
Ask me questions while you tour the home.