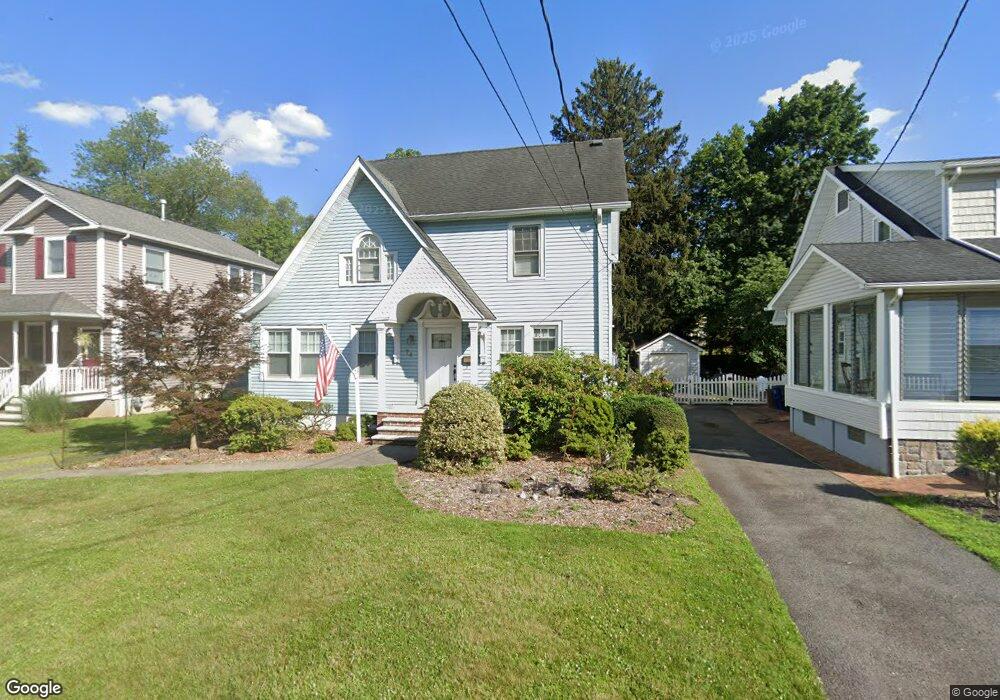
74 Columbus Ave Harrington Park, NJ 07640
Estimated Value: $657,549 - $813,000
--
Bed
--
Bath
1,339
Sq Ft
$537/Sq Ft
Est. Value
About This Home
This home is located at 74 Columbus Ave, Harrington Park, NJ 07640 and is currently estimated at $719,137, approximately $537 per square foot. 74 Columbus Ave is a home located in Bergen County with nearby schools including Harrington Park Elementary School, Northern Valley Regional High School at Old Tappan, and Acton Academy of Bergen County.
Ownership History
Date
Name
Owned For
Owner Type
Purchase Details
Closed on
Sep 1, 2022
Sold by
Baird Martha A
Bought by
Baird Martha A and Murphy Thomas F
Current Estimated Value
Purchase Details
Closed on
May 2, 2022
Sold by
Baird Martha A
Bought by
Murphy Joanne and Murphy Shannon L
Purchase Details
Closed on
Sep 18, 2002
Sold by
Michelson Kimberly L
Bought by
Duffy Kevin C
Create a Home Valuation Report for This Property
The Home Valuation Report is an in-depth analysis detailing your home's value as well as a comparison with similar homes in the area
Home Values in the Area
Average Home Value in this Area
Purchase History
| Date | Buyer | Sale Price | Title Company |
|---|---|---|---|
| Baird Martha A | -- | -- | |
| Murphy Joanne | -- | Paton Law Firm Llc | |
| Murphy Thomas F | -- | Paton Law Firm Llc | |
| Baird Martha A | -- | Paton Law Firm Llc | |
| Duffy Kevin C | $35,000 | -- |
Source: Public Records
Tax History Compared to Growth
Tax History
| Year | Tax Paid | Tax Assessment Tax Assessment Total Assessment is a certain percentage of the fair market value that is determined by local assessors to be the total taxable value of land and additions on the property. | Land | Improvement |
|---|---|---|---|---|
| 2025 | $12,308 | $393,600 | $252,500 | $141,100 |
| 2024 | $11,930 | $393,600 | $252,500 | $141,100 |
| 2023 | $11,733 | $393,600 | $252,500 | $141,100 |
| 2022 | $11,733 | $393,600 | $252,500 | $141,100 |
| 2021 | $11,651 | $393,600 | $252,500 | $141,100 |
| 2020 | $11,599 | $393,600 | $252,500 | $141,100 |
| 2019 | $11,355 | $393,600 | $252,500 | $141,100 |
| 2018 | $11,147 | $393,600 | $252,500 | $141,100 |
| 2017 | $11,029 | $393,600 | $252,500 | $141,100 |
| 2016 | $10,714 | $393,600 | $252,500 | $141,100 |
| 2015 | $10,446 | $393,600 | $252,500 | $141,100 |
| 2014 | $10,206 | $393,600 | $252,500 | $141,100 |
Source: Public Records
Map
Nearby Homes