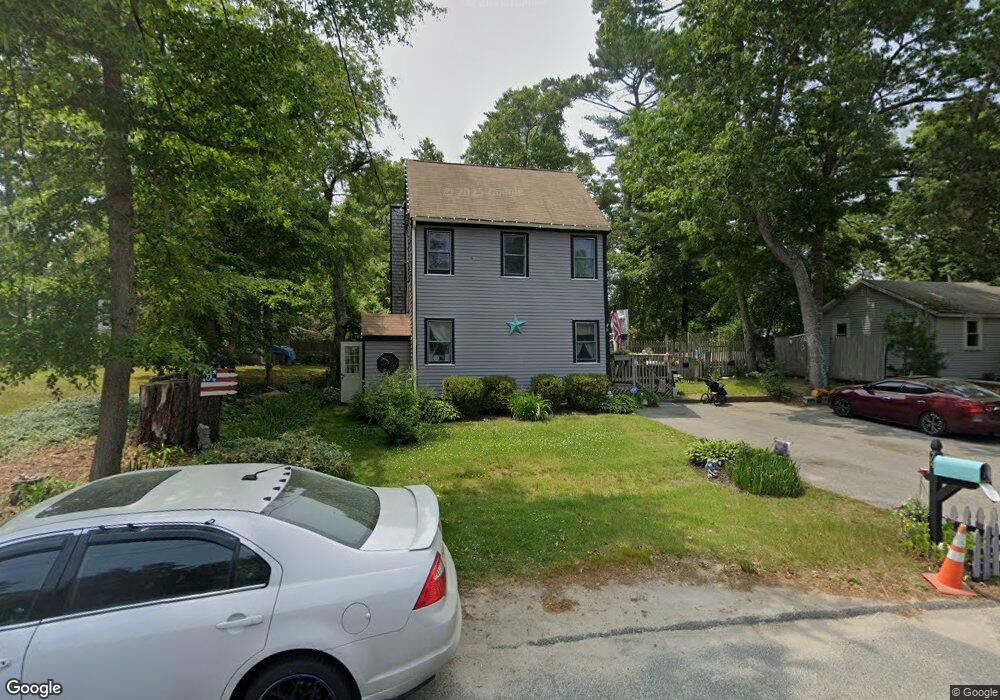
74 Cypress St Plymouth, MA 02360
Estimated Value: $413,000 - $453,000
2
Beds
1
Bath
340
Sq Ft
$1,290/Sq Ft
Est. Value
About This Home
This home is located at 74 Cypress St, Plymouth, MA 02360 and is currently estimated at $438,770, approximately $1,290 per square foot. 74 Cypress St is a home located in Plymouth County with nearby schools including South Elementary School, Plymouth South Middle School, and Plymouth South High School.
Ownership History
Date
Name
Owned For
Owner Type
Purchase Details
Closed on
Aug 8, 2023
Sold by
Freeman Tracy and Freeman Sean P
Bought by
Freeman Tracy
Current Estimated Value
Home Financials for this Owner
Home Financials are based on the most recent Mortgage that was taken out on this home.
Original Mortgage
$176,027
Outstanding Balance
$172,127
Interest Rate
6.96%
Mortgage Type
FHA
Estimated Equity
$266,643
Purchase Details
Closed on
Jul 31, 2023
Sold by
Freeman Sean P
Bought by
Freeman Tracy and Freeman Sean P
Home Financials for this Owner
Home Financials are based on the most recent Mortgage that was taken out on this home.
Original Mortgage
$176,027
Outstanding Balance
$172,127
Interest Rate
6.96%
Mortgage Type
FHA
Estimated Equity
$266,643
Purchase Details
Closed on
Aug 15, 1997
Sold by
Fhlmc
Bought by
Freeman Sean P
Purchase Details
Closed on
May 16, 1996
Sold by
Clayton Daniel H and Clayton Fhlmc
Bought by
Fhlmc
Create a Home Valuation Report for This Property
The Home Valuation Report is an in-depth analysis detailing your home's value as well as a comparison with similar homes in the area
Home Values in the Area
Average Home Value in this Area
Purchase History
| Date | Buyer | Sale Price | Title Company |
|---|---|---|---|
| Freeman Tracy | -- | None Available | |
| Freeman Tracy | -- | None Available | |
| Freeman Tracy | -- | None Available | |
| Freeman Tracy | -- | None Available | |
| Freeman Sean P | $49,900 | -- | |
| Fhlmc | $59,900 | -- | |
| Freeman Sean P | $49,900 | -- | |
| Fhlmc | $59,900 | -- |
Source: Public Records
Mortgage History
| Date | Status | Borrower | Loan Amount |
|---|---|---|---|
| Open | Freeman Tracy | $176,027 | |
| Closed | Freeman Tracy | $176,027 | |
| Previous Owner | Fhlmc | $39,000 | |
| Previous Owner | Fhlmc | $176,000 |
Source: Public Records
Tax History Compared to Growth
Tax History
| Year | Tax Paid | Tax Assessment Tax Assessment Total Assessment is a certain percentage of the fair market value that is determined by local assessors to be the total taxable value of land and additions on the property. | Land | Improvement |
|---|---|---|---|---|
| 2025 | $5,332 | $420,200 | $167,000 | $253,200 |
| 2024 | $5,139 | $399,300 | $163,500 | $235,800 |
| 2023 | $4,853 | $354,000 | $142,800 | $211,200 |
| 2022 | $4,205 | $272,500 | $129,800 | $142,700 |
| 2021 | $4,171 | $258,100 | $129,800 | $128,300 |
| 2020 | $3,940 | $241,000 | $113,700 | $127,300 |
| 2019 | $3,796 | $229,500 | $101,200 | $128,300 |
| 2018 | $3,636 | $220,900 | $93,500 | $127,400 |
| 2017 | $3,490 | $210,500 | $93,500 | $117,000 |
| 2016 | $3,236 | $198,900 | $80,900 | $118,000 |
| 2015 | $3,179 | $204,600 | $85,700 | $118,900 |
| 2014 | $3,173 | $209,700 | $90,400 | $119,300 |
Source: Public Records
Map
Nearby Homes
- 47 Lake Dr
- 110 Packard St
- 901 Head of The Bay Rd
- 14 Buttonwood Ln
- 23 Pine Ridge Rd
- 19 Milford St
- 11 Thompson Rd Unit 11A
- 11 Thompson Rd Unit A
- 15 Downey St
- 27 Baker Ln Unit 27
- 13 Hideaway Village Unit G
- 810 Head of The Bay Rd
- 83 Red Brook Rd
- 74 Martin St
- 73 Lewis Point Rd
- 65 Lewis Point Rd
- 43 Butler St
- 0 Lewis Point Rd
- 40 Cohasset Rd
- 22 Wallace Point
- 76 Cypress St
- 72 Cypress St
- 53 Walnut St
- 51 Walnut St
- 78 Cypress St
- 73 Cypress St
- 55 Walnut St
- 77 Cypress St
- 77 Cypress St Unit 1
- 77 Cypress St
- 77 Cypress St Unit A
- 49 Walnut St
- 71 Cypress St
- 80 Cypress St
- 79 Cypress St
- 79 Cypress St Unit 1
- 68 Cypress St
- 47 Walnut St
- 100 Buzzards Bay Dr
- 60 Buzzards Bay Dr