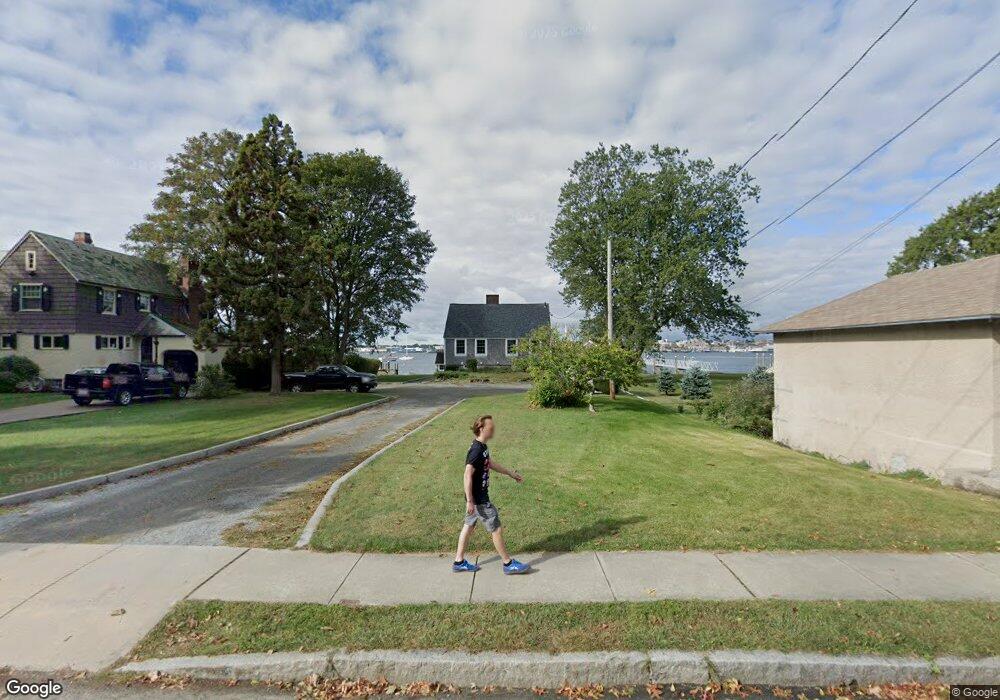
74 Fort St Fairhaven, MA 02719
Estimated Value: $512,000 - $1,081,535
5
Beds
3
Baths
928
Sq Ft
$942/Sq Ft
Est. Value
About This Home
This home is located at 74 Fort St, Fairhaven, MA 02719 and is currently estimated at $874,384, approximately $942 per square foot. 74 Fort St is a home located in Bristol County with nearby schools including Fairhaven High School, City On A Hill Charter Public School New Bedford, and St. Joseph School.
Ownership History
Date
Name
Owned For
Owner Type
Purchase Details
Closed on
Jun 17, 2014
Sold by
Brodeur Mark A and Brodeur Nina S
Bought by
Feener Aaron
Current Estimated Value
Home Financials for this Owner
Home Financials are based on the most recent Mortgage that was taken out on this home.
Original Mortgage
$400,000
Outstanding Balance
$305,048
Interest Rate
4.27%
Mortgage Type
New Conventional
Estimated Equity
$569,336
Purchase Details
Closed on
Jan 24, 2001
Sold by
Brodeur Machine Co Inc
Bought by
Brodeur Mark A
Create a Home Valuation Report for This Property
The Home Valuation Report is an in-depth analysis detailing your home's value as well as a comparison with similar homes in the area
Home Values in the Area
Average Home Value in this Area
Purchase History
| Date | Buyer | Sale Price | Title Company |
|---|---|---|---|
| Feener Aaron | $500,000 | -- | |
| Brodeur Mark A | $165,000 | -- |
Source: Public Records
Mortgage History
| Date | Status | Borrower | Loan Amount |
|---|---|---|---|
| Open | Feener Aaron | $400,000 | |
| Previous Owner | Brodeur Mark A | $2,550,000 | |
| Previous Owner | Brodeur Mark A | $500,000 | |
| Previous Owner | Brodeur Mark A | $1,850,000 | |
| Previous Owner | Brodeur Mark A | $4,360,000 |
Source: Public Records
Tax History Compared to Growth
Tax History
| Year | Tax Paid | Tax Assessment Tax Assessment Total Assessment is a certain percentage of the fair market value that is determined by local assessors to be the total taxable value of land and additions on the property. | Land | Improvement |
|---|---|---|---|---|
| 2025 | $88 | $942,800 | $666,100 | $276,700 |
| 2024 | $8,588 | $930,400 | $666,100 | $264,300 |
| 2023 | $8,147 | $818,800 | $652,200 | $166,600 |
| 2022 | $8,157 | $798,100 | $638,400 | $159,700 |
| 2021 | $6,672 | $591,000 | $458,000 | $133,000 |
| 2020 | $6,536 | $591,000 | $458,000 | $133,000 |
| 2019 | $6,348 | $544,000 | $416,300 | $127,700 |
| 2018 | $49 | $535,500 | $416,300 | $119,200 |
| 2017 | $6,006 | $498,800 | $388,600 | $110,200 |
| 2016 | $6,044 | $496,200 | $388,600 | $107,600 |
| 2015 | $5,832 | $480,000 | $381,700 | $98,300 |
Source: Public Records
Map
Nearby Homes