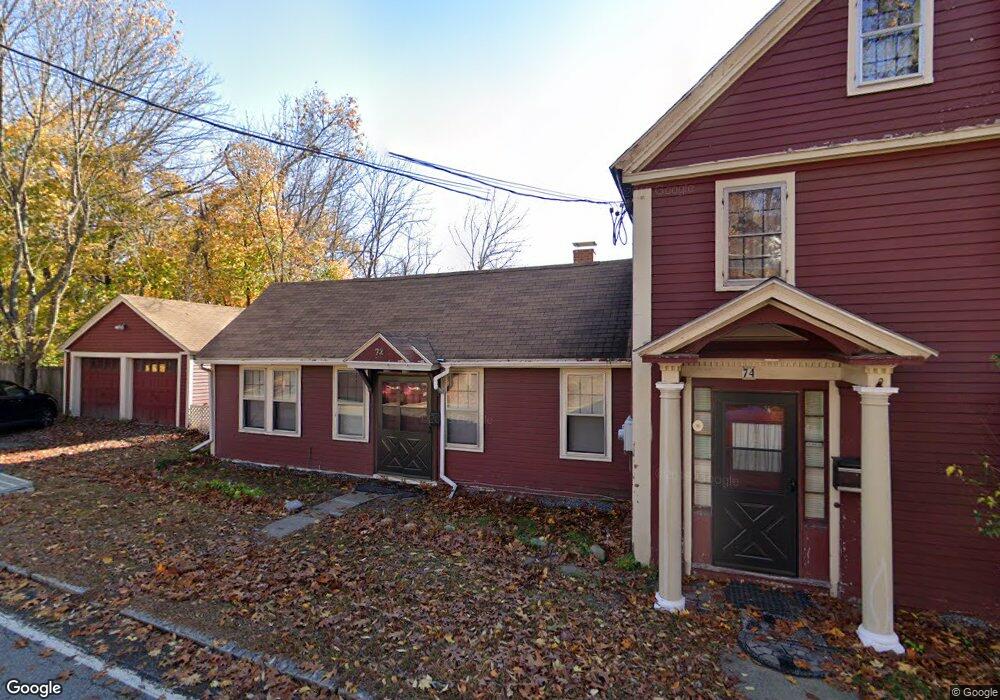
74 Lowell St Andover, MA 01810
Shawsheen Heights NeighborhoodEstimated Value: $929,000 - $1,134,429
5
Beds
3
Baths
2,608
Sq Ft
$396/Sq Ft
Est. Value
About This Home
This home is located at 74 Lowell St, Andover, MA 01810 and is currently estimated at $1,033,607, approximately $396 per square foot. 74 Lowell St is a home located in Essex County with nearby schools including West Elementary School, Andover West Middle School, and Andover High School.
Ownership History
Date
Name
Owned For
Owner Type
Purchase Details
Closed on
Jun 5, 2023
Sold by
Mahon Edith G
Bought by
Mahon Garcia T and Mahon M
Current Estimated Value
Purchase Details
Closed on
Feb 27, 2023
Sold by
Mahon Garcia T and Mahon Garcia
Bought by
Mahon Edith G
Purchase Details
Closed on
Apr 26, 2016
Sold by
Mahon Edith G and Garcia Calixto
Bought by
Mahon Garcia T and Mahon Garcia
Purchase Details
Closed on
Nov 25, 2008
Sold by
Mahon Edith G and Garcia Calixto
Bought by
Mahon Edith G and Garcia Calixto
Create a Home Valuation Report for This Property
The Home Valuation Report is an in-depth analysis detailing your home's value as well as a comparison with similar homes in the area
Home Values in the Area
Average Home Value in this Area
Purchase History
| Date | Buyer | Sale Price | Title Company |
|---|---|---|---|
| Mahon Garcia T | -- | None Available | |
| Mahon Edith G | -- | None Available | |
| Mahon Garcia T | -- | -- | |
| Mahon Edith G | -- | -- |
Source: Public Records
Tax History
| Year | Tax Paid | Tax Assessment Tax Assessment Total Assessment is a certain percentage of the fair market value that is determined by local assessors to be the total taxable value of land and additions on the property. | Land | Improvement |
|---|---|---|---|---|
| 2024 | $12,172 | $945,000 | $458,500 | $486,500 |
| 2023 | $10,879 | $796,400 | $424,900 | $371,500 |
| 2022 | $9,559 | $654,700 | $360,900 | $293,800 |
| 2021 | $9,151 | $598,500 | $328,600 | $269,900 |
| 2020 | $8,613 | $573,800 | $320,800 | $253,000 |
| 2019 | $8,281 | $542,300 | $311,700 | $230,600 |
| 2018 | $7,923 | $506,600 | $294,200 | $212,400 |
| 2017 | $7,204 | $474,600 | $288,600 | $186,000 |
| 2016 | $6,700 | $452,100 | $288,600 | $163,500 |
| 2015 | $6,605 | $441,200 | $277,700 | $163,500 |
Source: Public Records
Map
Nearby Homes
- 30 Canterbury St
- 40 Chandler Cir
- 16 Balmoral St Unit 214
- 50C Washington Park Dr Unit 10
- 21 Clubview Dr Unit 21
- 2 Powder Mill Square Unit 2B
- 25 Clubview Dr Unit 25
- 42 York St
- 37 Crenshaw Ln Unit 37
- 1 Sweeney Ct
- 22 Bobby Jones Dr
- 5 Lewis St
- 28 Stirling St
- 102 Weare St
- 181 High St Unit 1
- Lot 7 Weeping Willow Dr
- 54 Birch Rd
- 1 Longwood Dr Unit 105
- 12B Stevens St
- 96 Beacon St
Your Personal Tour Guide
Ask me questions while you tour the home.