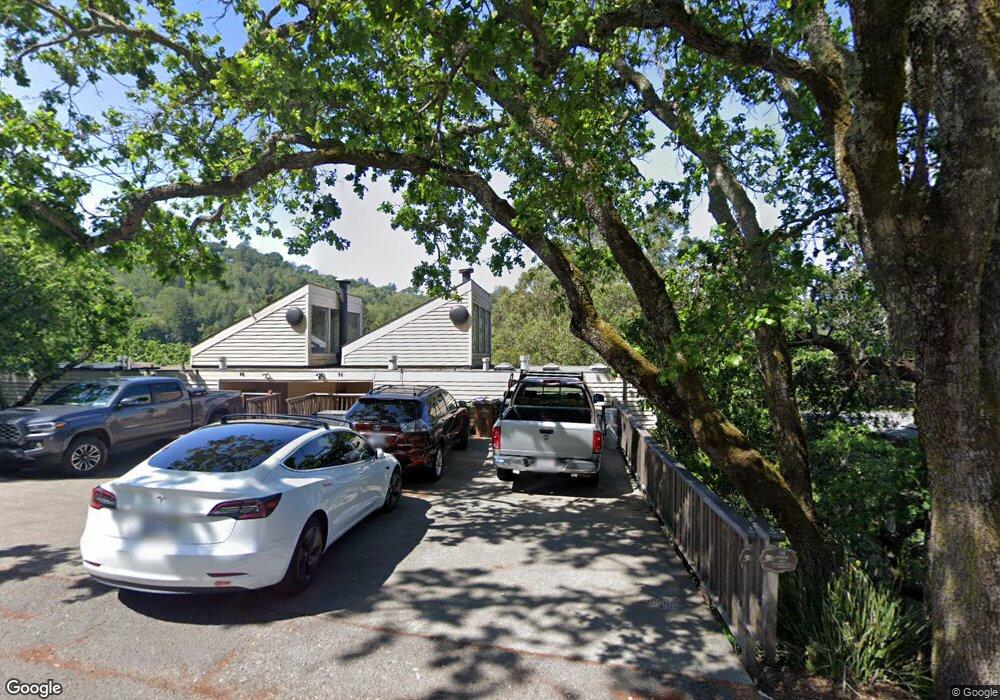
74 Martens Blvd San Rafael, CA 94901
Gerstle Park NeighborhoodEstimated Value: $1,365,000 - $1,827,138
6
Beds
5
Baths
3,024
Sq Ft
$514/Sq Ft
Est. Value
About This Home
This home is located at 74 Martens Blvd, San Rafael, CA 94901 and is currently estimated at $1,553,285, approximately $513 per square foot. 74 Martens Blvd is a home located in Marin County with nearby schools including Laurel Dell Elementary School, James B. Davidson Middle School, and San Rafael High School.
Ownership History
Date
Name
Owned For
Owner Type
Purchase Details
Closed on
Apr 23, 2020
Sold by
Armour Janet L and The Janet L Armour 2000 Trust
Bought by
Zanco Amy
Current Estimated Value
Home Financials for this Owner
Home Financials are based on the most recent Mortgage that was taken out on this home.
Original Mortgage
$960,000
Outstanding Balance
$853,626
Interest Rate
3.6%
Mortgage Type
New Conventional
Estimated Equity
$699,659
Purchase Details
Closed on
Feb 18, 2000
Sold by
Armour Janet L
Bought by
Armour Janet L
Create a Home Valuation Report for This Property
The Home Valuation Report is an in-depth analysis detailing your home's value as well as a comparison with similar homes in the area
Home Values in the Area
Average Home Value in this Area
Purchase History
| Date | Buyer | Sale Price | Title Company |
|---|---|---|---|
| Zanco Amy | $774,193 | First American Title Company | |
| Armour Janet L | -- | -- |
Source: Public Records
Mortgage History
| Date | Status | Borrower | Loan Amount |
|---|---|---|---|
| Open | Zanco Amy | $960,000 |
Source: Public Records
Tax History Compared to Growth
Tax History
| Year | Tax Paid | Tax Assessment Tax Assessment Total Assessment is a certain percentage of the fair market value that is determined by local assessors to be the total taxable value of land and additions on the property. | Land | Improvement |
|---|---|---|---|---|
| 2025 | $18,803 | $1,312,356 | $546,815 | $765,541 |
| 2024 | $18,803 | $1,286,628 | $536,095 | $750,533 |
| 2023 | $18,422 | $1,261,404 | $525,585 | $735,819 |
| 2022 | $17,446 | $1,236,672 | $515,280 | $721,392 |
| 2021 | $17,176 | $1,212,432 | $505,180 | $707,252 |
| 2020 | $5,606 | $221,355 | $42,288 | $179,067 |
| 2019 | $5,218 | $217,015 | $41,459 | $175,556 |
| 2018 | $5,171 | $212,762 | $40,647 | $172,115 |
| 2017 | $5,038 | $208,591 | $39,850 | $168,741 |
| 2016 | $4,859 | $204,502 | $39,069 | $165,433 |
| 2015 | $4,656 | $201,430 | $38,482 | $162,948 |
| 2014 | $4,413 | $197,484 | $37,728 | $159,756 |
Source: Public Records
Map
Nearby Homes