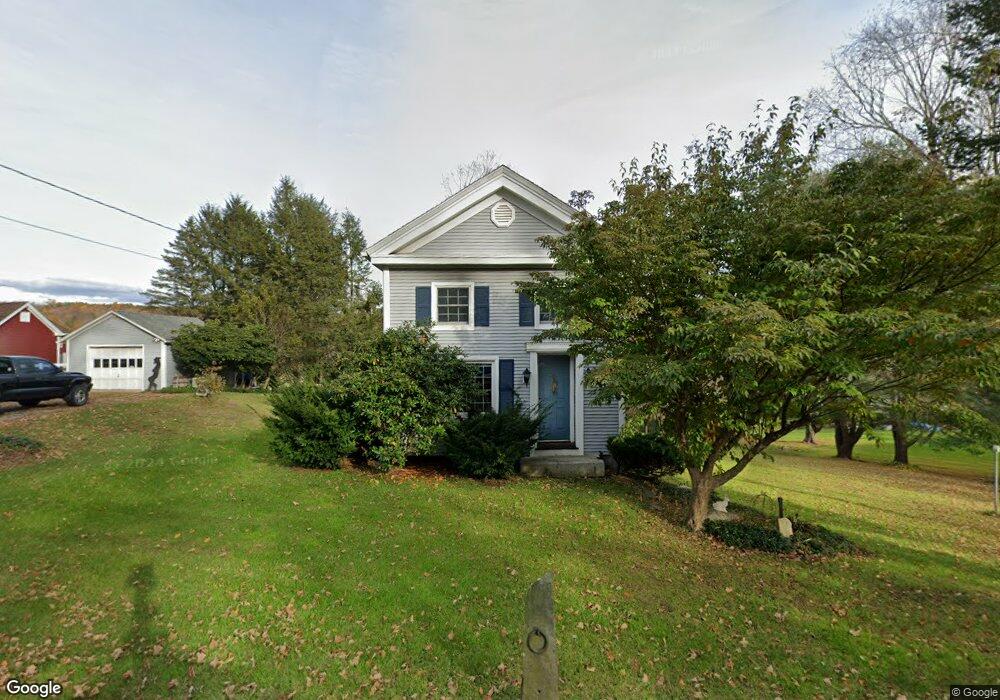
74 N Moodus Rd Moodus, CT 06469
Estimated Value: $304,000 - $337,000
2
Beds
1
Bath
1,284
Sq Ft
$249/Sq Ft
Est. Value
About This Home
This home is located at 74 N Moodus Rd, Moodus, CT 06469 and is currently estimated at $319,242, approximately $248 per square foot. 74 N Moodus Rd is a home located in Middlesex County with nearby schools including East Haddam Elementary School, Nathan Hale-Ray Middle School, and Nathan Hale-Ray High School.
Ownership History
Date
Name
Owned For
Owner Type
Purchase Details
Closed on
Jun 22, 2017
Sold by
Powling Peter
Bought by
Powling Peter and Powling Eileen
Current Estimated Value
Create a Home Valuation Report for This Property
The Home Valuation Report is an in-depth analysis detailing your home's value as well as a comparison with similar homes in the area
Home Values in the Area
Average Home Value in this Area
Purchase History
| Date | Buyer | Sale Price | Title Company |
|---|---|---|---|
| Powling Peter | -- | -- |
Source: Public Records
Tax History
| Year | Tax Paid | Tax Assessment Tax Assessment Total Assessment is a certain percentage of the fair market value that is determined by local assessors to be the total taxable value of land and additions on the property. | Land | Improvement |
|---|---|---|---|---|
| 2025 | $4,469 | $159,250 | $63,560 | $95,690 |
| 2024 | $4,262 | $159,250 | $63,560 | $95,690 |
| 2023 | $4,101 | $159,250 | $63,560 | $95,690 |
| 2022 | $3,863 | $121,520 | $52,010 | $69,510 |
| 2021 | $3,699 | $121,520 | $52,010 | $69,510 |
| 2020 | $3,699 | $121,520 | $52,010 | $69,510 |
| 2019 | $3,699 | $121,520 | $52,010 | $69,510 |
| 2018 | $3,604 | $121,520 | $52,010 | $69,510 |
| 2017 | $3,613 | $122,150 | $53,760 | $68,390 |
| 2016 | $3,585 | $122,150 | $53,760 | $68,390 |
| 2015 | $3,503 | $122,150 | $53,760 | $68,390 |
| 2014 | $3,408 | $122,150 | $53,760 | $68,390 |
Source: Public Records
Map
Nearby Homes
- 65 Clark Gates Rd
- 5 Pinehurst Ln Unit 5
- 8 Augusta Cir Unit 8
- 141 Sillimanville Rd
- 122 Falls Rd
- 5 Joe Williams Rd
- 206 N Moodus Rd
- 10 Highland Ave
- 154 Falls Rd
- 90 Falls Bashan Rd
- 53 Falls Bashan Rd
- 76 White Sands Rd
- 74 Pine Rd
- 8 Hickory Ct
- 145 Lakeview Dr
- 289 Young St
- 85 Bogel Rd
- 2 Morgan Ln
- 55 Bogel Rd
- 424 Moodus Rd
- 70 N Moodus Rd
- 78 N Moodus Rd
- 68 N Moodus Rd
- 73 N Moodus Rd
- 79 N Moodus Rd
- 71 N Moodus Rd
- 69 N Moodus Rd
- 64 N Moodus Rd
- 65 N Moodus Rd
- 77 N Moodus Rd
- 56 N Moodus Rd
- 57 N Moodus Rd
- 1 Clark Gates Rd
- 2 Clark Gates Rd
- 54 N Moodus Rd
- 2 Clark Gates Rd
- 59 N Moodus Rd
- 89 N Moodus Rd
- 50 N Moodus Rd
- 49 N Moodus Rd
Your Personal Tour Guide
Ask me questions while you tour the home.