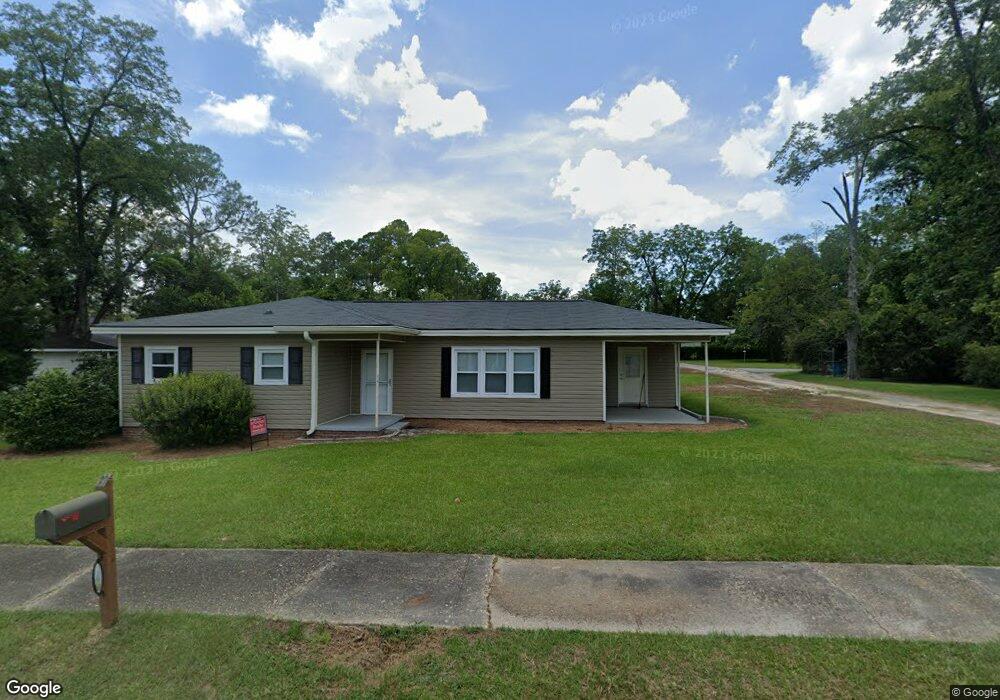
74 S 2nd Ave McRae-helena, GA 31055
Estimated Value: $118,000 - $136,000
2
Beds
1
Bath
1,076
Sq Ft
$117/Sq Ft
Est. Value
About This Home
This home is located at 74 S 2nd Ave, McRae-helena, GA 31055 and is currently estimated at $125,672, approximately $116 per square foot. 74 S 2nd Ave is a home located in Telfair County with nearby schools including Telfair County Elementary School, Telfair County Middle School, and Telfair County High School.
Ownership History
Date
Name
Owned For
Owner Type
Purchase Details
Closed on
Sep 5, 2024
Sold by
Atchley Treat Stacy
Bought by
Perryman Andrew
Current Estimated Value
Home Financials for this Owner
Home Financials are based on the most recent Mortgage that was taken out on this home.
Original Mortgage
$93,750
Outstanding Balance
$62,121
Interest Rate
6.95%
Mortgage Type
New Conventional
Estimated Equity
$63,551
Purchase Details
Closed on
Nov 30, 2015
Sold by
Atchley Mary Lowry
Bought by
Treat Stacy Atchley
Purchase Details
Closed on
Nov 12, 1997
Sold by
Atchely Mary L and Atchely Jon
Bought by
Atchely Mary L
Purchase Details
Closed on
Dec 21, 1995
Bought by
Atchely Mary L and Atchely Jon
Purchase Details
Closed on
Aug 9, 1994
Bought by
Atchely Mary L
Purchase Details
Closed on
Jul 8, 1994
Bought by
Girardeau Girardeau M and Girardeau Atchle
Purchase Details
Closed on
Mar 25, 1994
Bought by
Giradeau Giradeau M and Giradeau Lowey
Create a Home Valuation Report for This Property
The Home Valuation Report is an in-depth analysis detailing your home's value as well as a comparison with similar homes in the area
Home Values in the Area
Average Home Value in this Area
Purchase History
| Date | Buyer | Sale Price | Title Company |
|---|---|---|---|
| Perryman Andrew | $125,000 | -- | |
| Perryman Andrew | $125,000 | -- | |
| Treat Stacy Atchley | -- | -- | |
| Atchely Mary L | -- | -- | |
| Atchely Mary L | -- | -- | |
| Atchely Mary L | $16,800 | -- | |
| Girardeau Girardeau M | -- | -- | |
| Giradeau Giradeau M | -- | -- |
Source: Public Records
Mortgage History
| Date | Status | Borrower | Loan Amount |
|---|---|---|---|
| Open | Perryman Andrew | $93,750 | |
| Closed | Perryman Andrew | $93,750 |
Source: Public Records
Tax History Compared to Growth
Tax History
| Year | Tax Paid | Tax Assessment Tax Assessment Total Assessment is a certain percentage of the fair market value that is determined by local assessors to be the total taxable value of land and additions on the property. | Land | Improvement |
|---|---|---|---|---|
| 2024 | $1,509 | $37,372 | $2,261 | $35,111 |
| 2023 | $1,441 | $35,614 | $2,261 | $33,353 |
| 2022 | $1,060 | $35,614 | $2,261 | $33,353 |
| 2021 | $754 | $24,115 | $2,261 | $21,854 |
| 2020 | $703 | $22,089 | $2,261 | $19,828 |
| 2019 | $706 | $22,089 | $2,261 | $19,828 |
| 2018 | $967 | $22,449 | $2,261 | $20,188 |
| 2017 | $726 | $22,785 | $2,261 | $20,524 |
| 2016 | $726 | $22,785 | $2,261 | $20,524 |
| 2015 | -- | $22,785 | $2,261 | $20,524 |
| 2014 | -- | $23,432 | $2,072 | $21,360 |
| 2013 | -- | $24,185 | $2,826 | $21,359 |
Source: Public Records
Map
Nearby Homes
- 78 S Second Ave
- 47 S First Ave
- 125 Fifth Ave
- 141 S First Ave
- 27 E Bruce St
- 0 Ll350 & 398 7th District Unit 30490
- 36 Strozier St
- 0 Bonaire St Unit 10647239
- 210 W Graham St
- 15 Ben Ave
- 76 E Grant St
- 427 3rd Ave
- 160 E Willow Creek Ln
- 22 Spring Ave
- 17 2nd St
- Lot 126 Pansy Ln
- 0 Jackson Ave Unit 10548102
- 00 U S 341
- 0 U S 23
- 0 Concord Dr Unit 10542376
- 74 S Second Ave
- 29 W Graham St
- 18 W Liberty St
- 81 S Third Ave
- 17 W Graham St
- 36 Liberty St
- 14 W Liberty St
- 27 W Liberty St
- 33 W Liberty St
- 83 Seventh Ave
- 90 N Second Ave
- 17 W Liberty St
- 60 S Second Ave
- 78 S First Ave
- 41 W Liberty St
- 7 W Graham St
- 16 Graham St
- 11 W Liberty St
- 65 S Third Ave Unit 4
- 65 S Third Ave Unit 4 & 5