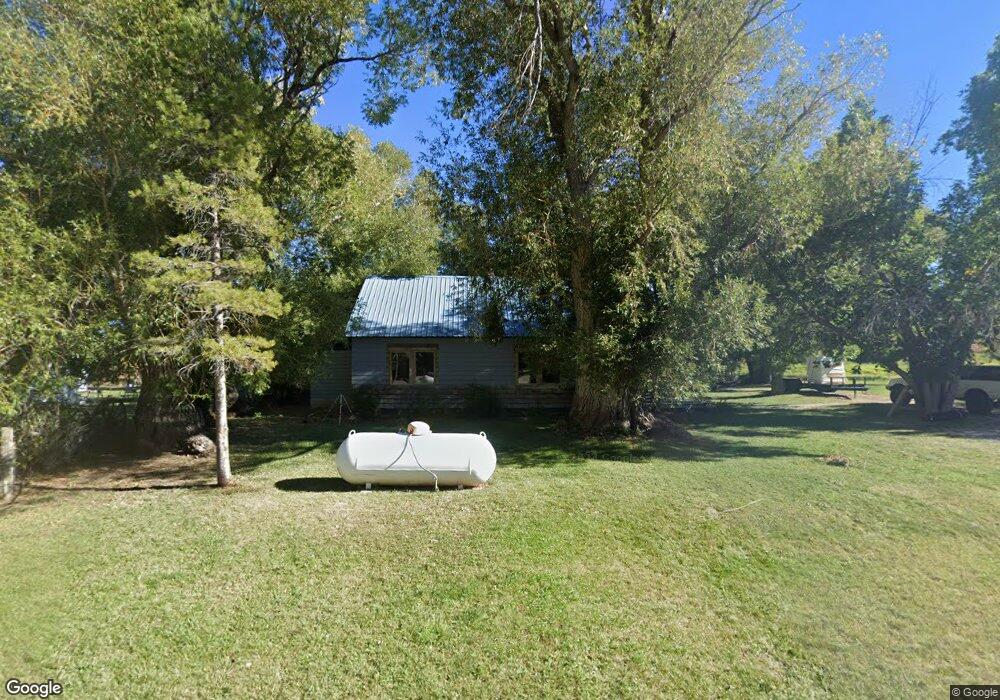
74 Spring Valley Dr Unit Lower North Fork Lander, WY 82520
Estimated Value: $353,563 - $437,000
2
Beds
1
Bath
1,499
Sq Ft
$257/Sq Ft
Est. Value
About This Home
This home is located at 74 Spring Valley Dr Unit Lower North Fork, Lander, WY 82520 and is currently estimated at $384,521, approximately $256 per square foot. 74 Spring Valley Dr Unit Lower North Fork is a home located in Fremont County with nearby schools including Lander Valley High School.
Ownership History
Date
Name
Owned For
Owner Type
Purchase Details
Closed on
Nov 18, 2020
Sold by
Murty Suresh A
Bought by
Anderson Jessie R and Anderson Wade
Current Estimated Value
Home Financials for this Owner
Home Financials are based on the most recent Mortgage that was taken out on this home.
Original Mortgage
$265,000
Outstanding Balance
$235,812
Interest Rate
2.8%
Mortgage Type
VA
Estimated Equity
$148,709
Purchase Details
Closed on
Dec 6, 2018
Sold by
Allen Sarah K and Miller Tannar K
Bought by
Murty Suresh A
Home Financials for this Owner
Home Financials are based on the most recent Mortgage that was taken out on this home.
Original Mortgage
$237,500
Interest Rate
4.8%
Mortgage Type
New Conventional
Purchase Details
Closed on
Sep 8, 2009
Sold by
Warren Naureen M and Neubauer Victor P
Bought by
Francis Emily M
Create a Home Valuation Report for This Property
The Home Valuation Report is an in-depth analysis detailing your home's value as well as a comparison with similar homes in the area
Home Values in the Area
Average Home Value in this Area
Purchase History
| Date | Buyer | Sale Price | Title Company |
|---|---|---|---|
| Anderson Jessie R | -- | None Available | |
| Murty Suresh A | -- | None Available | |
| Francis Emily M | -- | County Title Inc |
Source: Public Records
Mortgage History
| Date | Status | Borrower | Loan Amount |
|---|---|---|---|
| Open | Anderson Jessie R | $265,000 | |
| Previous Owner | Murty Suresh A | $237,500 |
Source: Public Records
Tax History Compared to Growth
Tax History
| Year | Tax Paid | Tax Assessment Tax Assessment Total Assessment is a certain percentage of the fair market value that is determined by local assessors to be the total taxable value of land and additions on the property. | Land | Improvement |
|---|---|---|---|---|
| 2025 | $1,898 | $21,432 | $4,450 | $16,982 |
| 2024 | $1,898 | $29,288 | $5,933 | $23,355 |
| 2023 | $1,817 | $28,389 | $5,933 | $22,456 |
| 2022 | $1,553 | $25,207 | $5,933 | $19,274 |
| 2021 | $1,421 | $22,621 | $5,933 | $16,688 |
| 2020 | $1,368 | $18,939 | $5,933 | $13,006 |
| 2019 | $1,521 | $20,693 | $5,933 | $14,760 |
| 2018 | $1,548 | $20,818 | $5,933 | $14,885 |
| 2017 | $1,547 | $20,740 | $5,933 | $14,807 |
| 2016 | $1,493 | $20,061 | $5,933 | $14,128 |
| 2015 | $1,435 | $19,512 | $5,933 | $13,579 |
| 2014 | $1,340 | $18,245 | $5,933 | $12,312 |
Source: Public Records
Map
Nearby Homes
- 28a Spring Valley Dr
- 317 Rosewood Ave
- 655 Longview Ln
- 2067 Baldwin Creek Rd
- 0 Baldwin Creek Rd Unit 24005149
- 0 Baldwin Creek Rd Unit 11520931
- 3 Latigo Ln
- 0000 Baldwin Creek Rd
- 167 Western Ave
- 55 Western Ave
- 1530 W Main St
- 225 Chapman St
- 655 N 10th St
- 665 N 9th St
- 926 Hobson St
- 200 Irwin Ln
- 654 W Main St
- 908 11th St
- 665 6th Street Ct
- 655 Amoretti St
- 74 Spring Valley Dr
- 75 Spring Valley Dr
- 71 Spring Valley Dr
- 77 Spring Valley Dr
- 16 Lower North Fork Rd
- 72 Spring Valley Dr
- 7 Lower North Fork Rd
- 4620 Us Highway 287 Unit Lower North Fork Rd.
- 4872 Us Highway 287
- 60 Spring Valley Dr
- 4 N Fork Rd
- 4615 Us Highway 287
- 56 Spring Valley Dr
- 49 Spring Valley Dr
- 4575 Us Highway 287
- 4540 Us Highway 287
- 8 N Fork Rd
- 4515 Us Highway 287
- 35 Spring Valley Dr
- 4492 Us Highway 287