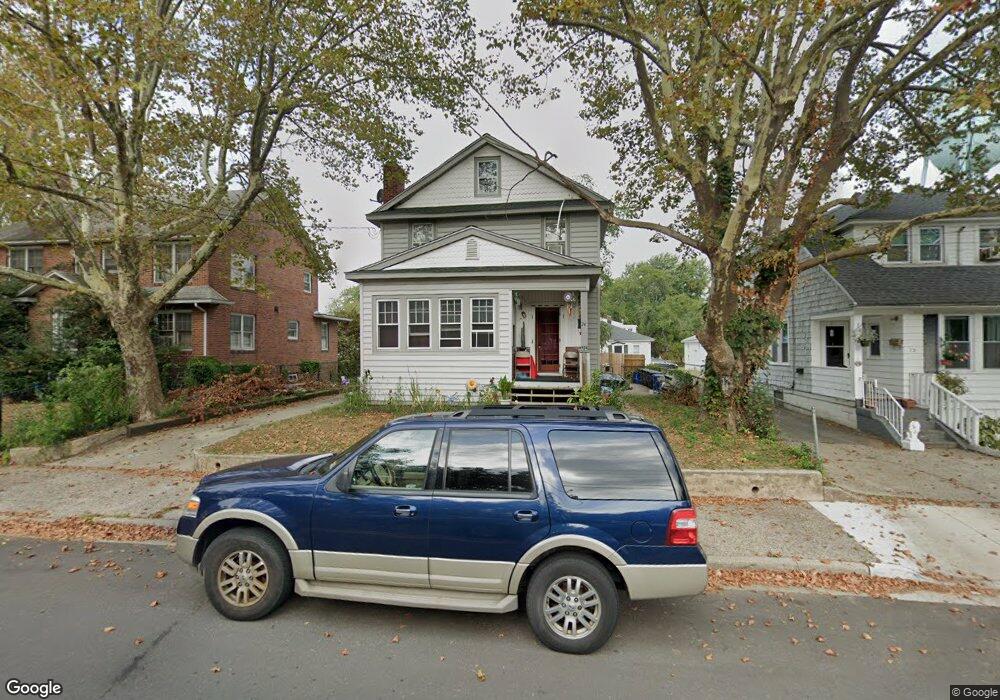
74 State St Penns Grove, NJ 08069
Estimated Value: $181,000 - $222,000
--
Bed
--
Bath
1,498
Sq Ft
$131/Sq Ft
Est. Value
About This Home
This home is located at 74 State St, Penns Grove, NJ 08069 and is currently estimated at $196,106, approximately $130 per square foot. 74 State St is a home located in Salem County with nearby schools including Lafayette-Pershing Elementary School, Paul W. Carleton Elementary School, and Field Street Elementary School.
Ownership History
Date
Name
Owned For
Owner Type
Purchase Details
Closed on
Apr 28, 2006
Sold by
Huckoby Teresa L and Huckoby Edward
Bought by
Ottinger Danny L
Current Estimated Value
Home Financials for this Owner
Home Financials are based on the most recent Mortgage that was taken out on this home.
Original Mortgage
$113,998
Outstanding Balance
$66,023
Interest Rate
6.4%
Mortgage Type
FHA
Estimated Equity
$130,083
Purchase Details
Closed on
Dec 2, 1997
Sold by
Granberg Richard and Clausing Peggy
Bought by
Howard Theresa L
Home Financials for this Owner
Home Financials are based on the most recent Mortgage that was taken out on this home.
Original Mortgage
$62,653
Interest Rate
7.28%
Mortgage Type
FHA
Create a Home Valuation Report for This Property
The Home Valuation Report is an in-depth analysis detailing your home's value as well as a comparison with similar homes in the area
Home Values in the Area
Average Home Value in this Area
Purchase History
| Date | Buyer | Sale Price | Title Company |
|---|---|---|---|
| Ottinger Danny L | $114,900 | None Available | |
| Howard Theresa L | $60,000 | -- |
Source: Public Records
Mortgage History
| Date | Status | Borrower | Loan Amount |
|---|---|---|---|
| Open | Ottinger Danny L | $113,998 | |
| Previous Owner | Howard Theresa L | $62,653 |
Source: Public Records
Tax History Compared to Growth
Tax History
| Year | Tax Paid | Tax Assessment Tax Assessment Total Assessment is a certain percentage of the fair market value that is determined by local assessors to be the total taxable value of land and additions on the property. | Land | Improvement |
|---|---|---|---|---|
| 2025 | $5,285 | $95,300 | $11,900 | $83,400 |
| 2024 | $5,108 | $95,300 | $11,900 | $83,400 |
| 2023 | $5,108 | $95,300 | $11,900 | $83,400 |
| 2022 | $4,924 | $95,300 | $11,900 | $83,400 |
| 2021 | $4,712 | $95,300 | $11,900 | $83,400 |
| 2020 | $4,774 | $95,300 | $11,900 | $83,400 |
| 2019 | $4,794 | $95,300 | $11,900 | $83,400 |
| 2018 | $5,268 | $130,600 | $20,500 | $110,100 |
| 2017 | $5,287 | $130,600 | $20,500 | $110,100 |
| 2016 | $5,087 | $130,600 | $20,500 | $110,100 |
| 2015 | $4,873 | $130,600 | $20,500 | $110,100 |
| 2014 | $4,819 | $130,600 | $20,500 | $110,100 |
Source: Public Records
Map
Nearby Homes
- 106 Sack Ave
- 85 State St
- 106 S Broad St
- 80 S Broad St
- 88 Railroad Ave
- 15 Walnut St
- 91 Mill St
- 3 Naylor Ave
- 65 S Broad St
- 50 Mill St
- 0 Delaware Dr
- 32 Westminster Ave
- 34 38 Cumberland Ave
- 59-61 Walnut St
- 32 Walnut St
- 55 57 Walnut St
- 0 Lincoln Avenue & Cumberland
- 39 41 Cumberland Ave
- 78 W Harmony St
- 204 206 S Broad St
- 66-68 State St
- 66 State St Unit 68
- 70-72 State St
- 70 State St Unit 72
- 67 State St
- 62 State St Unit 64
- 71 State St
- 80 State St
- 60 State St Unit 2
- 60 State St
- 75 State St Unit 77
- 73 State St
- 84 State St
- 104 Sack Ave
- 109 Sack Ave
- 51 State St
- 20 Sack Ave
- 48 State St Unit 50
- 111 Sack Ave
- 15 Sack Ave Unit 17