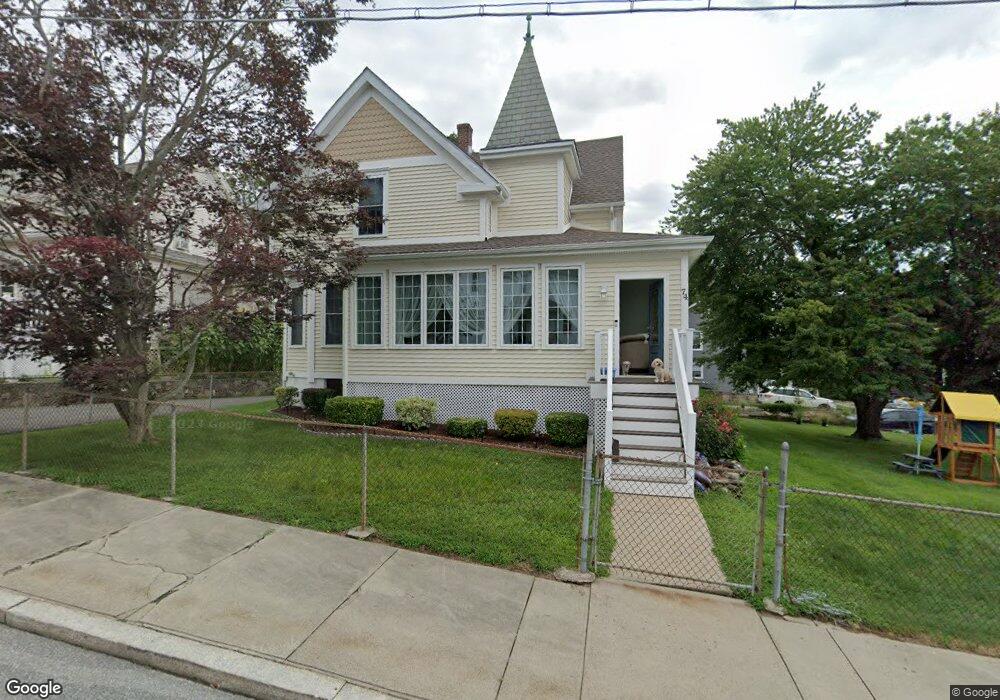
74 Vine St Woonsocket, RI 02895
North End NeighborhoodEstimated Value: $397,000 - $455,000
3
Beds
2
Baths
1,540
Sq Ft
$273/Sq Ft
Est. Value
About This Home
This home is located at 74 Vine St, Woonsocket, RI 02895 and is currently estimated at $419,775, approximately $272 per square foot. 74 Vine St is a home located in Providence County with nearby schools including Woonsocket High School, Rise Prep Mayoral Academy Middle School, and Rise Prep Mayoral Academy.
Ownership History
Date
Name
Owned For
Owner Type
Purchase Details
Closed on
May 22, 2019
Sold by
Woonsocket City Of
Bought by
East Coast Properties Llc
Current Estimated Value
Purchase Details
Closed on
Apr 11, 1996
Sold by
Colli Aldo E and Colli Dean R
Bought by
Fleet Mortgage Corp
Purchase Details
Closed on
Jan 27, 1993
Sold by
Colli Aldo E and Colli Eleanor
Bought by
Colli Aldo E and Colli Dean R
Create a Home Valuation Report for This Property
The Home Valuation Report is an in-depth analysis detailing your home's value as well as a comparison with similar homes in the area
Home Values in the Area
Average Home Value in this Area
Purchase History
| Date | Buyer | Sale Price | Title Company |
|---|---|---|---|
| East Coast Properties Llc | $2,430 | -- | |
| East Coast Properties Llc | $2,430 | -- | |
| Fleet Mortgage Corp | $128,500 | -- | |
| Fleet Mortgage Corp | $128,500 | -- | |
| Colli Aldo E | $129,000 | -- |
Source: Public Records
Mortgage History
| Date | Status | Borrower | Loan Amount |
|---|---|---|---|
| Previous Owner | Colli Aldo E | $220,000 | |
| Previous Owner | Colli Aldo E | $186,000 | |
| Previous Owner | Colli Aldo E | $136,500 |
Source: Public Records
Tax History
| Year | Tax Paid | Tax Assessment Tax Assessment Total Assessment is a certain percentage of the fair market value that is determined by local assessors to be the total taxable value of land and additions on the property. | Land | Improvement |
|---|---|---|---|---|
| 2025 | $4,591 | $408,800 | $96,100 | $312,700 |
| 2024 | $4,561 | $313,700 | $91,300 | $222,400 |
| 2023 | $4,386 | $313,700 | $91,300 | $222,400 |
| 2022 | $4,386 | $313,700 | $91,300 | $222,400 |
| 2021 | $4,786 | $201,500 | $58,800 | $142,700 |
| 2020 | $4,836 | $201,500 | $58,800 | $142,700 |
| 2018 | $4,852 | $201,500 | $58,800 | $142,700 |
| 2017 | $4,735 | $157,300 | $53,700 | $103,600 |
| 2016 | $5,008 | $157,300 | $53,700 | $103,600 |
| 2015 | $5,754 | $157,300 | $53,700 | $103,600 |
| 2014 | $5,262 | $146,400 | $59,100 | $87,300 |
Source: Public Records
Map
Nearby Homes
- 589 Gaskill St
- 542 Prospect St
- 458 Prospect St
- 154 156 Winter St
- 83 Summer St
- 130 E School St
- 60 Fairlawn Ave
- 56 Winter St
- 10 Huntington Ave
- 44 Federal St
- 256 Privilege St
- 11 Federal St
- 308 Harris Ave
- 58 Oakley Rd
- 40 Valley St
- 0 N Main St Unit 1401765
- 42 Elbow St
- 115 Railroad St
- 60 Rathbun St
- 36 Fairmount St
Your Personal Tour Guide
Ask me questions while you tour the home.