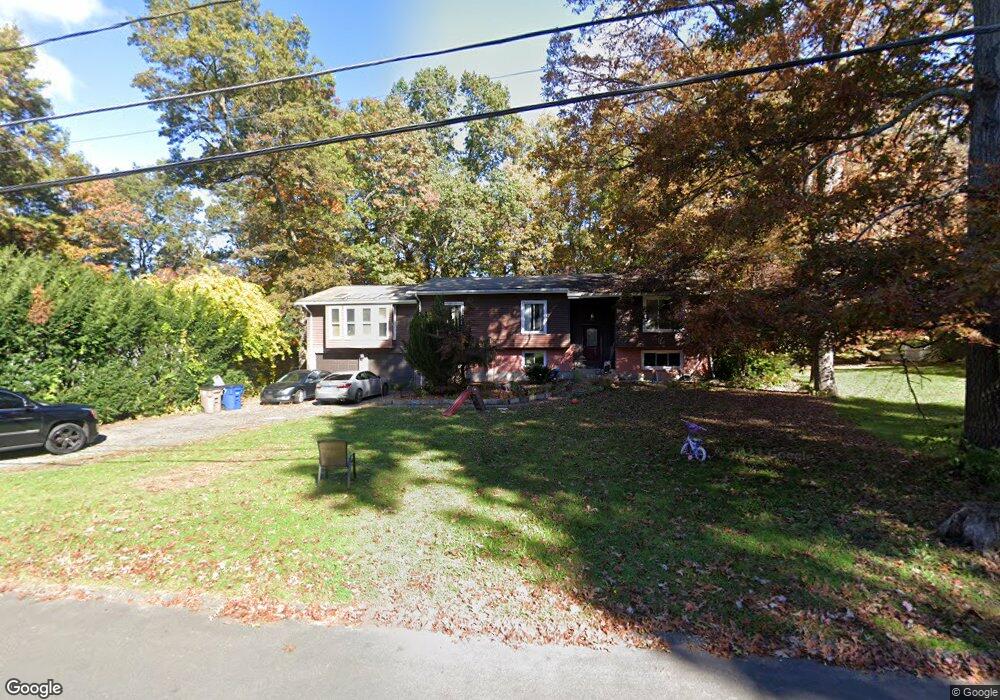
74 Wilshire Rd Vernon Rockville, CT 06066
North Vernon NeighborhoodEstimated Value: $435,000 - $486,000
3
Beds
3
Baths
1,942
Sq Ft
$235/Sq Ft
Est. Value
About This Home
This home is located at 74 Wilshire Rd, Vernon Rockville, CT 06066 and is currently estimated at $456,877, approximately $235 per square foot. 74 Wilshire Rd is a home located in Tolland County with nearby schools including Center Road School, Vernon Center Middle School, and Rockville High School.
Ownership History
Date
Name
Owned For
Owner Type
Purchase Details
Closed on
May 19, 2016
Sold by
Uddin Zaka and Shah Amais A
Bought by
Shah Waqas
Current Estimated Value
Home Financials for this Owner
Home Financials are based on the most recent Mortgage that was taken out on this home.
Original Mortgage
$229,900
Outstanding Balance
$182,100
Interest Rate
3.59%
Mortgage Type
Purchase Money Mortgage
Estimated Equity
$274,777
Purchase Details
Closed on
Dec 1, 2004
Sold by
Chobotor James and Chobotor Katherine
Bought by
Uddin Zaka and Uddin Awais Ali
Purchase Details
Closed on
May 12, 2003
Sold by
Roberts Steven and Roberts Pamela
Bought by
Chobotor James and Chobotor Katherine
Purchase Details
Closed on
Nov 22, 1994
Sold by
Gottier Karin
Bought by
Roberts Steven and Roberts Pamela
Create a Home Valuation Report for This Property
The Home Valuation Report is an in-depth analysis detailing your home's value as well as a comparison with similar homes in the area
Home Values in the Area
Average Home Value in this Area
Purchase History
| Date | Buyer | Sale Price | Title Company |
|---|---|---|---|
| Shah Waqas | $242,000 | -- | |
| Uddin Zaka | $262,000 | -- | |
| Chobotor James | $235,000 | -- | |
| Roberts Steven | $145,000 | -- | |
| Shah Waqas | $242,000 | -- | |
| Uddin Zaka | $262,000 | -- | |
| Chobotor James | $235,000 | -- | |
| Roberts Steven | $145,000 | -- |
Source: Public Records
Mortgage History
| Date | Status | Borrower | Loan Amount |
|---|---|---|---|
| Open | Roberts Steven | $229,900 | |
| Closed | Roberts Steven | $229,900 |
Source: Public Records
Tax History Compared to Growth
Tax History
| Year | Tax Paid | Tax Assessment Tax Assessment Total Assessment is a certain percentage of the fair market value that is determined by local assessors to be the total taxable value of land and additions on the property. | Land | Improvement |
|---|---|---|---|---|
| 2025 | $7,293 | $202,080 | $44,340 | $157,740 |
| 2024 | $7,091 | $202,080 | $44,340 | $157,740 |
| 2023 | $6,747 | $202,080 | $44,340 | $157,740 |
| 2022 | $6,747 | $202,080 | $44,340 | $157,740 |
| 2021 | $6,622 | $167,100 | $43,150 | $123,950 |
| 2020 | $6,622 | $167,100 | $43,150 | $123,950 |
| 2019 | $6,622 | $167,100 | $43,150 | $123,950 |
| 2018 | $6,622 | $167,100 | $43,150 | $123,950 |
| 2017 | $6,468 | $167,100 | $43,150 | $123,950 |
| 2016 | $6,441 | $169,360 | $49,250 | $120,110 |
| 2015 | $6,251 | $169,360 | $49,250 | $120,110 |
| 2014 | $6,116 | $169,360 | $49,250 | $120,110 |
Source: Public Records
Map
Nearby Homes
- 242 Talcottville Rd Unit 105
- 343 Merline Rd
- 119 Trout Stream Dr
- 33 Sunset Terrace
- 53 Winding Brook Trail
- 38 Winding Brook Trail
- 171 Center Rd
- 25 Oakview Place
- 29 Shady Brook Ln Unit 29
- 721 Dart Hill Rd
- 8 Summit Rd
- 77 Center Rd
- 565 Talcottville Rd Unit 1C4
- 6 Elizabeth Ln Unit 3
- 61 Tankerhoosen Rd
- 201 Regan Rd Unit 2B
- 4 Loveland Hill Rd Unit C4
- 989 Hartford Turnpike
- 42 Valley View Ln
- 20 Whitney Ferguson Rd Unit 18