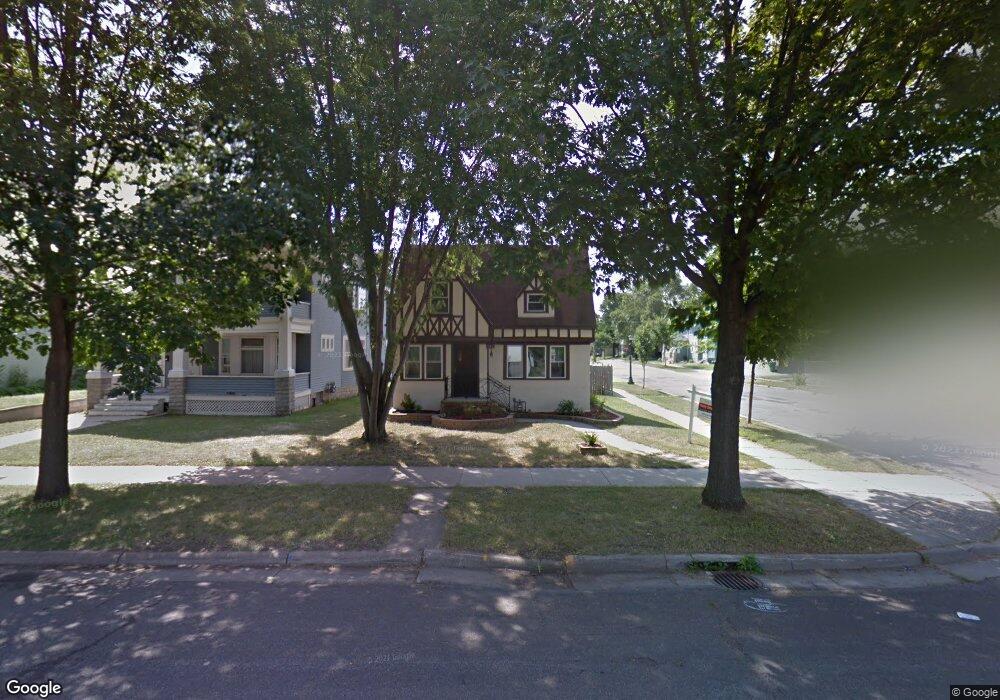
740 740 Rose Ave E St. Paul, MN 55106
Payne-Phalen NeighborhoodEstimated Value: $237,000 - $276,000
4
Beds
2
Baths
1,397
Sq Ft
$188/Sq Ft
Est. Value
About This Home
This home is located at 740 740 Rose Ave E, St. Paul, MN 55106 and is currently estimated at $262,037, approximately $187 per square foot. 740 740 Rose Ave E is a home located in Ramsey County with nearby schools including Bruce F Vento Elementary School, Washington Technology Magnet School, and LIFE Prep School.
Ownership History
Date
Name
Owned For
Owner Type
Purchase Details
Closed on
Feb 5, 2016
Sold by
Nasca Whitney
Bought by
Peterson Benjamin A and Karkula Erin A
Current Estimated Value
Home Financials for this Owner
Home Financials are based on the most recent Mortgage that was taken out on this home.
Original Mortgage
$157,200
Outstanding Balance
$125,195
Interest Rate
3.92%
Mortgage Type
New Conventional
Estimated Equity
$136,842
Purchase Details
Closed on
Aug 22, 2014
Sold by
Le Lauren and Le Dat Cong
Bought by
Nasca Whitney
Home Financials for this Owner
Home Financials are based on the most recent Mortgage that was taken out on this home.
Original Mortgage
$140,600
Interest Rate
4.1%
Mortgage Type
New Conventional
Purchase Details
Closed on
May 13, 2013
Sold by
Secretary Of Housing & Urban Development
Bought by
Le Lauren
Purchase Details
Closed on
Apr 16, 2012
Sold by
Flagstar Bank Fsb
Bought by
The Secretary Of Housing & Urban Develop
Purchase Details
Closed on
Jun 30, 1999
Sold by
Gerth Jennifer L
Bought by
Jones Lori M
Create a Home Valuation Report for This Property
The Home Valuation Report is an in-depth analysis detailing your home's value as well as a comparison with similar homes in the area
Home Values in the Area
Average Home Value in this Area
Purchase History
We collect this data history from publicly available records. To have your information removed, we recommend requesting removal directly through your county’s website.
| Date | Buyer | Sale Price | Title Company |
|---|---|---|---|
| Peterson Benjamin A | $165,500 | Edina Realty Title Inc | |
| Nasca Whitney | $152,484 | Multiple | |
| Le Lauren | -- | None Available | |
| The Secretary Of Housing & Urban Develop | -- | None Available | |
| Jones Lori M | $103,000 | -- |
Source: Public Records
Mortgage History
We collect this data history from publicly available records. To have your information removed, we recommend requesting removal directly through your county’s website.
| Date | Status | Borrower | Loan Amount |
|---|---|---|---|
| Open | Peterson Benjamin A | $157,200 | |
| Previous Owner | Nasca Whitney | $140,600 |
Source: Public Records
Tax History
| Year | Tax Paid | Tax Assessment Tax Assessment Total Assessment is a certain percentage of the fair market value that is determined by local assessors to be the total taxable value of land and additions on the property. | Land | Improvement |
|---|---|---|---|---|
| 2025 | $3,648 | $241,800 | $25,000 | $216,800 |
| 2023 | $3,648 | $244,800 | $20,000 | $224,800 |
| 2022 | $2,676 | $240,800 | $20,000 | $220,800 |
| 2021 | $2,872 | $180,500 | $20,000 | $160,500 |
| 2020 | $3,084 | $198,100 | $9,800 | $188,300 |
| 2019 | $3,044 | $198,100 | $9,800 | $188,300 |
| 2018 | $2,500 | $193,500 | $9,800 | $183,700 |
| 2017 | $2,160 | $168,300 | $9,800 | $158,500 |
| 2016 | $1,898 | $0 | $0 | $0 |
| 2015 | $664 | $130,000 | $9,800 | $120,200 |
| 2014 | $1,114 | $0 | $0 | $0 |
Source: Public Records
Map
Nearby Homes
- 790 Geranium Ave E
- 714 Hawthorne Ave E
- 673 Jessamine Ave E
- 654 Jessamine Ave E
- 857 Rose Ave E
- 691 Orange Ave E
- 798 Cook Ave E
- 840 Magnolia Ave E
- 751 Lawson Ave E
- 609 Jessamine Ave E
- 1174 Edgerton St
- 895 Rose Ave E
- 595 Hawthorne Ave E
- 680 Lawson Ave E
- 1092 Edgerton St
- 915 Rose Ave E
- 1123 Edgerton St
- 758 Jenks Ave
- 869 Lawson Ave E
- 587 Cook Ave E
- 740 740 Rose-Avenue-e
- 740 Rose Ave E
- 746 Rose Ave E
- 750 Rose Ave E
- 736 736 Rose Ave E
- 736 Rose Ave E
- 752 Rose Ave E
- 741 Geranium Ave E
- 745 Geranium Ave E
- 749 Geranium Ave E
- 728 Rose Ave E
- 728 Rose Ave E Unit 3
- 741 Rose Ave E
- 743 Rose Ave E
- 753 Geranium Ave E
- 760 Rose Ave E
- 745 Rose Ave E
- 735 Geranium Ave E
- 729 Geranium Ave E
- 735 Rose Ave E
Your Personal Tour Guide
Ask me questions while you tour the home.