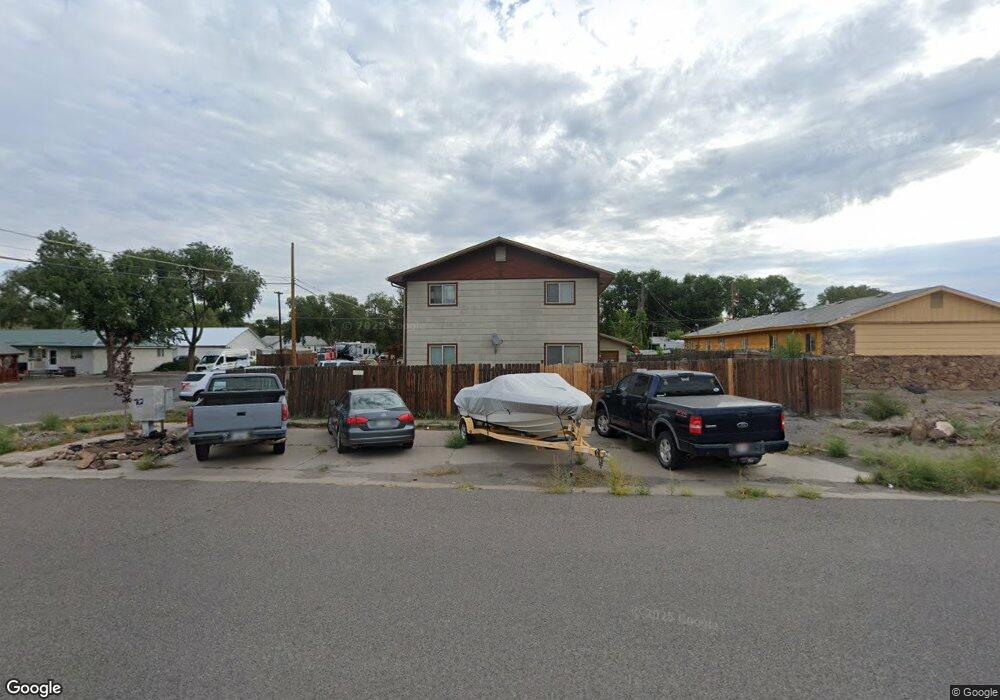
740 N Cascade Ave Unit 3 Montrose, CO 81401
Estimated Value: $228,000 - $309,000
3
Beds
1
Bath
1,120
Sq Ft
$245/Sq Ft
Est. Value
About This Home
This home is located at 740 N Cascade Ave Unit 3, Montrose, CO 81401 and is currently estimated at $274,497, approximately $245 per square foot. 740 N Cascade Ave Unit 3 is a home located in Montrose County with nearby schools including Northside Elementary School, Centennial Middle School, and Montrose High School.
Ownership History
Date
Name
Owned For
Owner Type
Purchase Details
Closed on
Jan 22, 2002
Sold by
Nozicka Paul E
Bought by
Nozicka Paul E Revocable Trust
Current Estimated Value
Purchase Details
Closed on
Sep 25, 1992
Sold by
Williams Janet Marie
Bought by
Nozicka Paul E
Purchase Details
Closed on
Apr 12, 1989
Sold by
Usa Acting Thru Fmha
Bought by
Williams Janet Marie
Purchase Details
Closed on
Oct 28, 1988
Sold by
Mills Samuel H and Mills Victoria L
Bought by
Usa Acting Thru Fmha
Purchase Details
Closed on
Apr 26, 1988
Sold by
Usa Acting Thru Fmha
Bought by
Mills Samuel H and Mills Victoria L
Purchase Details
Closed on
Mar 2, 1988
Sold by
Nuebert Sheryl M
Bought by
Usa Acting Thru Fmha
Purchase Details
Closed on
Jan 26, 1982
Sold by
Rodriguez Joaquin and Rodriguez Gloria M
Bought by
Neubert Sheryl M
Purchase Details
Closed on
Apr 21, 1981
Bought by
Rodriguez Joaquin and Rodriguez Gloria M
Create a Home Valuation Report for This Property
The Home Valuation Report is an in-depth analysis detailing your home's value as well as a comparison with similar homes in the area
Home Values in the Area
Average Home Value in this Area
Purchase History
| Date | Buyer | Sale Price | Title Company |
|---|---|---|---|
| Nozicka Paul E Revocable Trust | -- | -- | |
| Nozicka Paul E | $31,500 | -- | |
| Williams Janet Marie | -- | -- | |
| Usa Acting Thru Fmha | -- | -- | |
| Mills Samuel H | -- | -- | |
| Usa Acting Thru Fmha | -- | -- | |
| Neubert Sheryl M | $34,000 | -- | |
| Rodriguez Joaquin | -- | -- |
Source: Public Records
Tax History Compared to Growth
Tax History
| Year | Tax Paid | Tax Assessment Tax Assessment Total Assessment is a certain percentage of the fair market value that is determined by local assessors to be the total taxable value of land and additions on the property. | Land | Improvement |
|---|---|---|---|---|
| 2024 | $764 | $10,730 | $1,750 | $8,980 |
| 2023 | $764 | $14,950 | $2,430 | $12,520 |
| 2022 | $737 | $10,710 | $1,700 | $9,010 |
| 2021 | $760 | $11,020 | $1,750 | $9,270 |
| 2020 | $631 | $9,400 | $1,450 | $7,950 |
| 2019 | $635 | $9,400 | $1,450 | $7,950 |
| 2018 | $477 | $6,890 | $1,170 | $5,720 |
| 2017 | $473 | $6,890 | $1,170 | $5,720 |
| 2016 | $459 | $6,800 | $1,130 | $5,670 |
| 2015 | $451 | $6,800 | $1,130 | $5,670 |
| 2014 | $353 | $5,700 | $1,180 | $4,520 |
Source: Public Records
Map
Nearby Homes
- 638 N Cascade Ave
- 806 N Park Ave
- 512 N 5th St
- 945 N Selig Ave
- 700 N Nevada Ave
- 701 N 4th St
- 841 N Grand Ave
- 1201 N San Juan Ave
- Lot 131 Haynes Drives
- TBD-Lot 31 Mayfly Dr
- TBD-Lot 18 Mayfly Dr
- TBD - Lot 6 Mayfly Dr
- TBD - Lot 16 Mayfly Dr
- TBD - Lot 7 Mayfly Dr
- TBD Mayfly Dr
- TBD - Lot 4 Mayfly Dr
- TBD-Lot 27 Mayfly Dr
- TBD - Outlot A Mayfly Dr
- TBD- Lot 21 Mayfly Dr
- TBD Mayfly Dr Unit Lot 16
- N Casade Ave Unit 2
- 740 N Cascade Ave Unit 6
- 740 N Cascade Ave Unit 5
- 740 N Cascade Ave Unit 4
- 740 N Cascade Ave Unit 2
- 740 N Cascade Ave Unit 1
- 720 N Cascade Ave
- N Cascade Unit Unit 1
- N Cascade Unit Unit 6
- 714 N Cascade Ave
- N Cascade Ave Unit Unit 6
- 700 N Cascade Ave
- 804 N Cascade Ave
- 717 N Cascade Ave
- 420 N 8th St
- 733 N Uncompahgre Ave
- 725 N Uncompahgre Ave
- N Uncompaghre Ave
- 717 N Uncompahgre Ave
- TBD N Cascade Ave