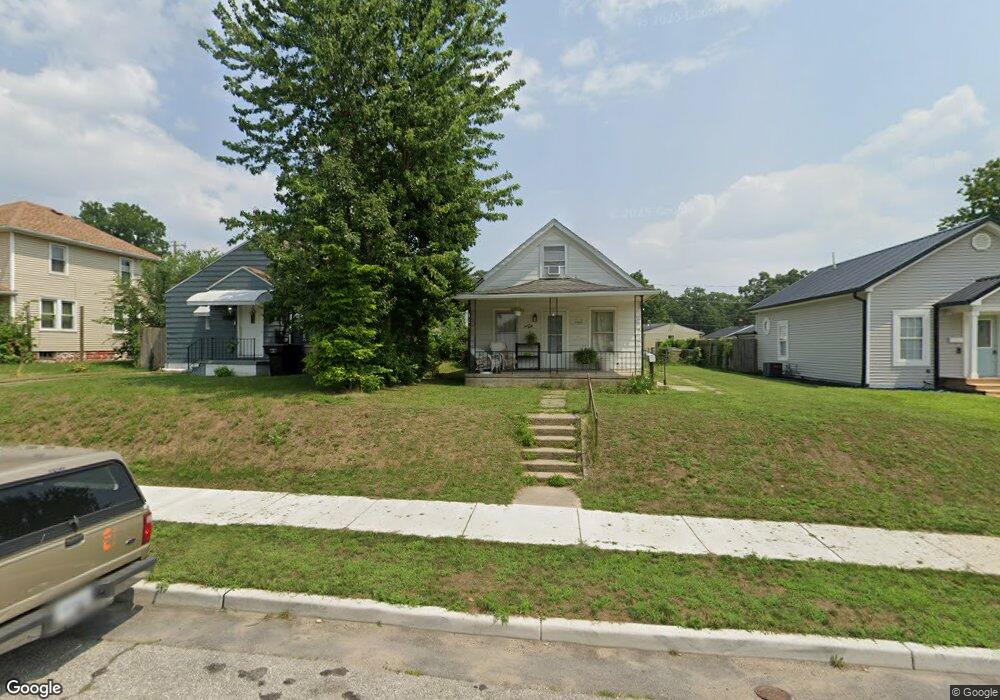
740 S 36th St South Bend, IN 46615
River Park NeighborhoodEstimated Value: $135,000 - $178,466
4
Beds
1
Bath
988
Sq Ft
$163/Sq Ft
Est. Value
About This Home
This home is located at 740 S 36th St, South Bend, IN 46615 and is currently estimated at $161,117, approximately $163 per square foot. 740 S 36th St is a home located in St. Joseph County with nearby schools including Nuner Fine Arts Academy, Jefferson Intermediate Traditional School, and Adams High School.
Ownership History
Date
Name
Owned For
Owner Type
Purchase Details
Closed on
Jan 31, 2025
Sold by
Madou Home Rentals Llc
Bought by
Great Lakes Growth Capital Llc
Current Estimated Value
Home Financials for this Owner
Home Financials are based on the most recent Mortgage that was taken out on this home.
Original Mortgage
$149,000
Outstanding Balance
$139,067
Interest Rate
6.27%
Mortgage Type
Seller Take Back
Estimated Equity
$22,050
Purchase Details
Closed on
Jul 14, 2005
Sold by
Madou Steven E and Madou Kevin T
Bought by
Madou Home Rentals Llc
Home Financials for this Owner
Home Financials are based on the most recent Mortgage that was taken out on this home.
Original Mortgage
$86,000
Interest Rate
5.74%
Mortgage Type
Future Advance Clause Open End Mortgage
Purchase Details
Closed on
Jan 13, 2005
Sold by
Beasley Brian L
Bought by
Madou Steven E and Madou Kevin T
Create a Home Valuation Report for This Property
The Home Valuation Report is an in-depth analysis detailing your home's value as well as a comparison with similar homes in the area
Home Values in the Area
Average Home Value in this Area
Purchase History
| Date | Buyer | Sale Price | Title Company |
|---|---|---|---|
| Great Lakes Growth Capital Llc | -- | Metropolitan Title | |
| Madou Home Rentals Llc | -- | None Available | |
| Madou Steven E | -- | None Available |
Source: Public Records
Mortgage History
| Date | Status | Borrower | Loan Amount |
|---|---|---|---|
| Open | Great Lakes Growth Capital Llc | $149,000 | |
| Previous Owner | Madou Home Rentals Llc | $86,000 |
Source: Public Records
Tax History Compared to Growth
Tax History
| Year | Tax Paid | Tax Assessment Tax Assessment Total Assessment is a certain percentage of the fair market value that is determined by local assessors to be the total taxable value of land and additions on the property. | Land | Improvement |
|---|---|---|---|---|
| 2024 | $1,698 | $71,000 | $6,400 | $64,600 |
| 2023 | $1,655 | $69,400 | $6,400 | $63,000 |
| 2022 | $1,665 | $69,400 | $6,400 | $63,000 |
| 2021 | $1,543 | $62,500 | $4,900 | $57,600 |
| 2020 | $1,538 | $62,300 | $4,900 | $57,400 |
| 2019 | $1,281 | $61,900 | $4,500 | $57,400 |
| 2018 | $1,542 | $62,800 | $4,500 | $58,300 |
| 2017 | $1,562 | $60,900 | $4,500 | $56,400 |
| 2016 | $1,541 | $58,800 | $2,400 | $56,400 |
| 2014 | $1,513 | $57,900 | $2,400 | $55,500 |
Source: Public Records
Map
Nearby Homes
- 741 S 36th St
- 809 S 36th St
- 1105 S 35th St
- 821 S 34th St
- 734 S 33rd St
- 515 S Logan St
- 3312 Mishawaka Ave
- 540 Webster St
- 625 S 32nd St
- 609 S 32nd St
- 626 S 30th St
- 910 W Borley Ave
- 3413 Northside Blvd
- 1229 S 34th St
- 3401 Northside Blvd
- 525 S 28th St
- 1213 Lincolnway W
- 110 S 33rd St
- 324 W Mishawaka Ave
- 610 S 27th St