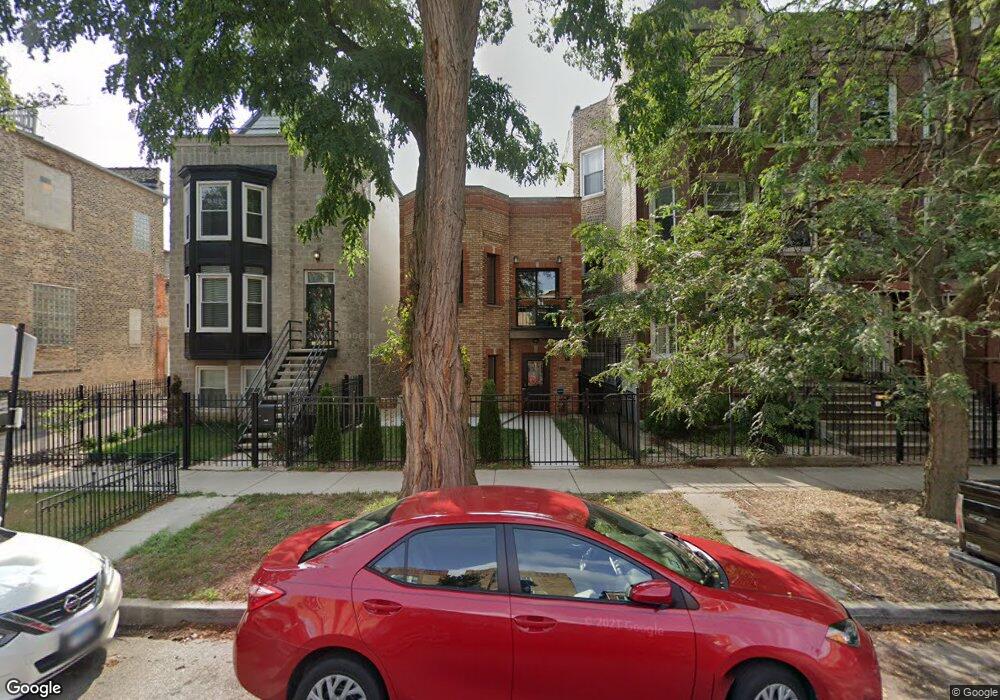
740 S Claremont Ave Chicago, IL 60612
Tri-Taylor NeighborhoodEstimated Value: $599,000 - $675,000
4
Beds
2
Baths
2,072
Sq Ft
$306/Sq Ft
Est. Value
About This Home
This home is located at 740 S Claremont Ave, Chicago, IL 60612 and is currently estimated at $633,023, approximately $305 per square foot. 740 S Claremont Ave is a home located in Cook County with nearby schools including Washington Irving Elementary School, Children Of Peace School, and Chicago Hope Academy.
Ownership History
Date
Name
Owned For
Owner Type
Purchase Details
Closed on
Oct 16, 2020
Sold by
Fanter Susan and Schmidt Susan
Bought by
Snodgrass Jeffrey and Eftekhari Azin
Current Estimated Value
Home Financials for this Owner
Home Financials are based on the most recent Mortgage that was taken out on this home.
Original Mortgage
$388,000
Outstanding Balance
$344,476
Interest Rate
2.8%
Mortgage Type
New Conventional
Estimated Equity
$288,547
Purchase Details
Closed on
Jul 28, 2015
Sold by
Naughton Shane and Naughton Lindsey
Bought by
Fanter Susan
Home Financials for this Owner
Home Financials are based on the most recent Mortgage that was taken out on this home.
Original Mortgage
$361,000
Interest Rate
3.99%
Mortgage Type
New Conventional
Purchase Details
Closed on
Oct 12, 2012
Sold by
Navigation Properties Llc
Bought by
Naughton Shane and Naughton Lindsey
Home Financials for this Owner
Home Financials are based on the most recent Mortgage that was taken out on this home.
Original Mortgage
$276,675
Interest Rate
3.75%
Mortgage Type
New Conventional
Purchase Details
Closed on
Apr 6, 2011
Sold by
North Star Trust Company
Bought by
Navigation Properties Llc
Create a Home Valuation Report for This Property
The Home Valuation Report is an in-depth analysis detailing your home's value as well as a comparison with similar homes in the area
Home Values in the Area
Average Home Value in this Area
Purchase History
| Date | Buyer | Sale Price | Title Company |
|---|---|---|---|
| Snodgrass Jeffrey | $485,000 | Attorneys Ttl Guaranty Fund | |
| Fanter Susan | $390,000 | Attorney | |
| Naughton Shane | $325,500 | None Available | |
| Navigation Properties Llc | $90,000 | First American Title |
Source: Public Records
Mortgage History
| Date | Status | Borrower | Loan Amount |
|---|---|---|---|
| Open | Snodgrass Jeffrey | $388,000 | |
| Previous Owner | Fanter Susan | $361,000 | |
| Previous Owner | Naughton Shane | $276,675 |
Source: Public Records
Tax History Compared to Growth
Tax History
| Year | Tax Paid | Tax Assessment Tax Assessment Total Assessment is a certain percentage of the fair market value that is determined by local assessors to be the total taxable value of land and additions on the property. | Land | Improvement |
|---|---|---|---|---|
| 2024 | $9,566 | $51,000 | $16,934 | $34,066 |
| 2023 | $9,304 | $48,500 | $13,608 | $34,892 |
| 2022 | $9,304 | $48,500 | $13,608 | $34,892 |
| 2021 | $9,113 | $48,500 | $13,608 | $34,892 |
| 2020 | $8,924 | $43,031 | $10,281 | $32,750 |
| 2019 | $8,841 | $47,287 | $10,281 | $37,006 |
| 2018 | $8,690 | $47,287 | $10,281 | $37,006 |
| 2017 | $8,165 | $41,174 | $9,072 | $32,102 |
| 2016 | $7,747 | $41,174 | $9,072 | $32,102 |
| 2015 | $7,064 | $41,174 | $9,072 | $32,102 |
| 2014 | $6,094 | $35,414 | $7,560 | $27,854 |
| 2013 | $6,198 | $36,709 | $7,560 | $29,149 |
Source: Public Records
Map
Nearby Homes
- 749 S Claremont Ave Unit 1
- 724 S Oakley Blvd Unit 7241
- 806 S Oakley Blvd
- 718 S Claremont Ave
- 3129 W Polk St
- 823 S Oakley Blvd
- 3119 W Flournoy St
- 2852-54 W Flournoy St
- 2838 W Flournoy St
- 815 S Bell Ave
- 2415 W Arthington St
- 604 S Western Ave
- 2332 W Harrison St Unit 1
- 2452 W Lexington St
- 2242 W Taylor St
- 1003 S Campbell Ave
- 2224 W Taylor St
- 2455 W Arthington St Unit 3
- 2432 W Harrison St Unit 3
- 1017 S Claremont Ave
- 738 S Claremont Ave
- 738 S Claremont Ave Unit 2
- 738 S Claremont Ave
- 736 S Claremont Ave Unit 2
- 736 S Claremont Ave
- 740 S Claremont Ave
- 742 S Claremont Ave
- 742 S Claremont Ave
- 734 S Claremont Ave Unit 2
- 730 S Claremont Ave
- 728 S Claremont Ave
- 2334 W Polk St Unit 23346
- 2334 W Polk St Unit 23343
- 2334 W Polk St Unit 23341
- 2334 W Polk St Unit 23344
- 2334 W Polk St Unit 23345
- 2334 W Polk St Unit 6
- 2334 W Polk St Unit 4
- 2334 W Polk St Unit 3
- 2340 W Polk St