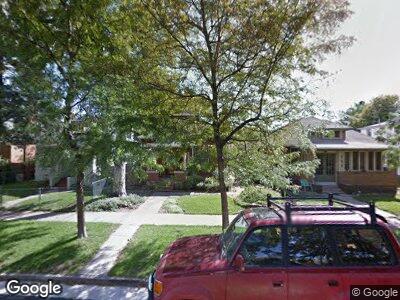
740 S Sherman St Denver, CO 80209
Washington Park West NeighborhoodEstimated Value: $666,000 - $779,000
2
Beds
1
Bath
988
Sq Ft
$741/Sq Ft
Est. Value
About This Home
This home is located at 740 S Sherman St, Denver, CO 80209 and is currently estimated at $731,640, approximately $740 per square foot. 740 S Sherman St is a home located in Denver County with nearby schools including Lincoln Elementary School, Grant Beacon Middle School, and South High School.
Ownership History
Date
Name
Owned For
Owner Type
Purchase Details
Closed on
Jan 15, 2003
Sold by
Wheeler Christopher C
Bought by
Chandler Lori E
Current Estimated Value
Home Financials for this Owner
Home Financials are based on the most recent Mortgage that was taken out on this home.
Original Mortgage
$150,000
Interest Rate
6.16%
Mortgage Type
Purchase Money Mortgage
Purchase Details
Closed on
Jun 30, 1997
Sold by
Smith Katherine D
Bought by
Wheeler Christopher C
Home Financials for this Owner
Home Financials are based on the most recent Mortgage that was taken out on this home.
Original Mortgage
$116,950
Interest Rate
7.5%
Purchase Details
Closed on
Feb 10, 1997
Sold by
Smith Marschall S and Smith Katherine D
Bought by
Smith Katherine D
Create a Home Valuation Report for This Property
The Home Valuation Report is an in-depth analysis detailing your home's value as well as a comparison with similar homes in the area
Home Values in the Area
Average Home Value in this Area
Purchase History
| Date | Buyer | Sale Price | Title Company |
|---|---|---|---|
| Chandler Lori E | $275,000 | Land Title Guarantee Company | |
| Wheeler Christopher C | $137,600 | First American Heritage Titl | |
| Smith Katherine D | -- | -- |
Source: Public Records
Mortgage History
| Date | Status | Borrower | Loan Amount |
|---|---|---|---|
| Open | Chandler Lori E | $127,000 | |
| Closed | Chandler Lori E | $150,000 | |
| Previous Owner | Wheeler Christopher C | $55,000 | |
| Previous Owner | Wheeler Christopher C | $40,000 | |
| Previous Owner | Wheeler Christopher C | $203,000 | |
| Previous Owner | Wheeler Christopher C | $200,000 | |
| Previous Owner | Wheeler Christopher C | $30,381 | |
| Previous Owner | Wheeler Christopher C | $160,000 | |
| Previous Owner | Wheeler Christopher C | $116,950 |
Source: Public Records
Tax History Compared to Growth
Tax History
| Year | Tax Paid | Tax Assessment Tax Assessment Total Assessment is a certain percentage of the fair market value that is determined by local assessors to be the total taxable value of land and additions on the property. | Land | Improvement |
|---|---|---|---|---|
| 2024 | $3,528 | $44,540 | $17,340 | $27,200 |
| 2023 | $3,451 | $44,540 | $17,340 | $27,200 |
| 2022 | $2,726 | $34,280 | $21,810 | $12,470 |
| 2021 | $2,632 | $35,270 | $22,440 | $12,830 |
| 2020 | $2,505 | $33,760 | $20,840 | $12,920 |
| 2019 | $2,435 | $33,760 | $20,840 | $12,920 |
| 2018 | $2,545 | $32,890 | $17,760 | $15,130 |
| 2017 | $2,537 | $32,890 | $17,760 | $15,130 |
| 2016 | $2,521 | $30,910 | $16,055 | $14,855 |
| 2015 | $2,415 | $30,910 | $16,055 | $14,855 |
| 2014 | $2,200 | $26,490 | $10,268 | $16,222 |
Source: Public Records
Map
Nearby Homes
- 764 S Sherman St
- 706 S Lincoln St
- 805 S Lincoln St
- 638 S Lincoln St
- 623 S Logan St
- 613 S Logan St
- 579 S Sherman St
- 553 S Sherman St
- 713 S Washington St
- 493 S Lincoln St
- 930 S Pennsylvania St
- 480 S Grant St
- 471 S Grant St
- 485 S Logan St Unit 10
- 511 S Pennsylvania St
- 460 S Sherman St
- 500 S Pennsylvania St Unit 520
- 969 S Pearl St Unit 305
- 969 S Pearl St Unit 204
- 427 S Lincoln St
- 740 S Sherman St
- 736 S Sherman St
- 750 S Sherman St
- 730 S Sherman St
- 756 S Sherman St
- 728 S Sherman St
- 724 S Sherman St
- 747 S Sherman St
- 735 S Sherman St
- 741 S Sherman St
- 753 S Sherman St
- 768 S Sherman St
- 755 S Sherman St
- 723 S Sherman St
- 749 S Grant St
- 718 S Sherman St
- 745 S Grant St
- 761 S Sherman St
- 755 S Grant St
- 731 S Grant St