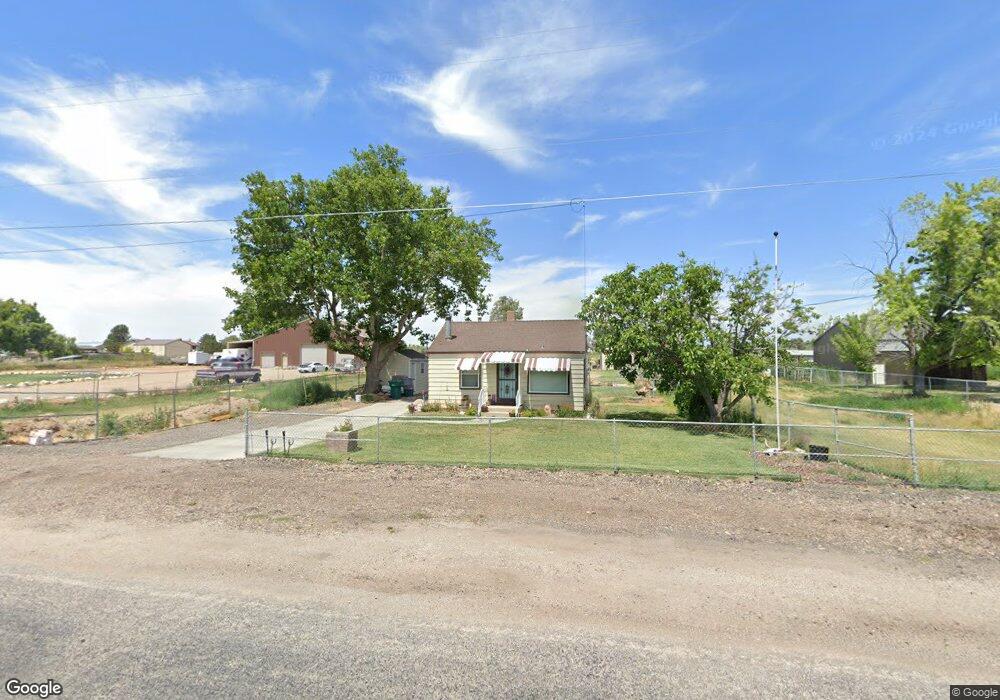
7400 W 5500 S Hooper, UT 84315
Estimated Value: $361,000 - $465,000
2
Beds
1
Bath
816
Sq Ft
$499/Sq Ft
Est. Value
About This Home
This home is located at 7400 W 5500 S, Hooper, UT 84315 and is currently estimated at $407,356, approximately $499 per square foot. 7400 W 5500 S is a home located in Weber County with nearby schools including Hooper Elementary School, Rocky Mountain Junior High School, and Fremont High School.
Ownership History
Date
Name
Owned For
Owner Type
Purchase Details
Closed on
Jun 10, 2022
Sold by
Ward Meggen H and Ward Logan H
Bought by
Ward Meggen and Ward Logan H
Current Estimated Value
Home Financials for this Owner
Home Financials are based on the most recent Mortgage that was taken out on this home.
Original Mortgage
$320,000
Outstanding Balance
$302,715
Interest Rate
4.63%
Mortgage Type
New Conventional
Estimated Equity
$104,641
Purchase Details
Closed on
Apr 26, 2021
Sold by
Ward Meggen
Bought by
Ward Meggen and Ward Logan H
Home Financials for this Owner
Home Financials are based on the most recent Mortgage that was taken out on this home.
Original Mortgage
$256,000
Interest Rate
3%
Mortgage Type
New Conventional
Purchase Details
Closed on
Dec 20, 2018
Sold by
Cunnington Lavona S and The Lavona S Cunnington Trust
Bought by
Ward Meggen and Ward Logan H
Home Financials for this Owner
Home Financials are based on the most recent Mortgage that was taken out on this home.
Original Mortgage
$220,825
Interest Rate
4.87%
Mortgage Type
FHA
Purchase Details
Closed on
May 16, 2013
Sold by
Cunnington Blaine R and Cunnington Lavona S
Bought by
Cunnington Blaine R and Cunnington Lavona S
Create a Home Valuation Report for This Property
The Home Valuation Report is an in-depth analysis detailing your home's value as well as a comparison with similar homes in the area
Home Values in the Area
Average Home Value in this Area
Purchase History
| Date | Buyer | Sale Price | Title Company |
|---|---|---|---|
| Ward Meggen | -- | None Listed On Document | |
| Ward Meggen | -- | Us Title Insurance Agency | |
| Ward Meggen | -- | Us Title Insurance Agenncy | |
| Ward Meggen | -- | Lincoln Title Ins Agcy | |
| Cunnington Lavona S | -- | Lincoln Title Ins Agcy | |
| Cunnington Blaine R | -- | None Available |
Source: Public Records
Mortgage History
| Date | Status | Borrower | Loan Amount |
|---|---|---|---|
| Open | Ward Meggen | $320,000 | |
| Previous Owner | Ward Meggen | $256,000 | |
| Previous Owner | Ward Meggen | $220,825 |
Source: Public Records
Tax History Compared to Growth
Tax History
| Year | Tax Paid | Tax Assessment Tax Assessment Total Assessment is a certain percentage of the fair market value that is determined by local assessors to be the total taxable value of land and additions on the property. | Land | Improvement |
|---|---|---|---|---|
| 2025 | $1,999 | $367,661 | $173,239 | $194,422 |
| 2024 | $1,929 | $199,096 | $95,281 | $103,815 |
| 2023 | $1,942 | $198,000 | $92,543 | $105,457 |
| 2022 | $2,032 | $211,200 | $71,611 | $139,589 |
| 2021 | $1,595 | $279,000 | $89,546 | $189,454 |
| 2020 | $1,583 | $253,998 | $79,308 | $174,690 |
| 2019 | $1,468 | $223,000 | $64,177 | $158,823 |
| 2018 | $1,252 | $182,001 | $64,177 | $117,824 |
| 2017 | $1,034 | $145,999 | $48,942 | $97,057 |
| 2016 | $829 | $63,389 | $25,700 | $37,689 |
| 2015 | $839 | $63,391 | $28,453 | $34,938 |
| 2014 | $803 | $59,100 | $28,453 | $30,647 |
Source: Public Records
Map
Nearby Homes
- 5319 S 7100 W
- 5801 S 7100 W
- 4100 S 5900 W
- 6360 W 5500 S
- 5752 W 2425 N
- 6014 W 5300 S
- 6036 W 4700 S
- 0 W 5500 S
- 3729 S 5600 W Unit 6
- 3720 S 5600 W Unit 2
- 3719 S 5600 W Unit 7
- 4146 S 5800 W Unit 5
- 4163 S 5800 W Unit 2
- 5335 W 5500 S
- 3632 S 5400 W
- 2084 N 4500 W
- 3706 S 5650 W Unit 9
- 4879 S 5050 W
- 4111 S 5350 W
- 3691 S 5600 W Unit 20