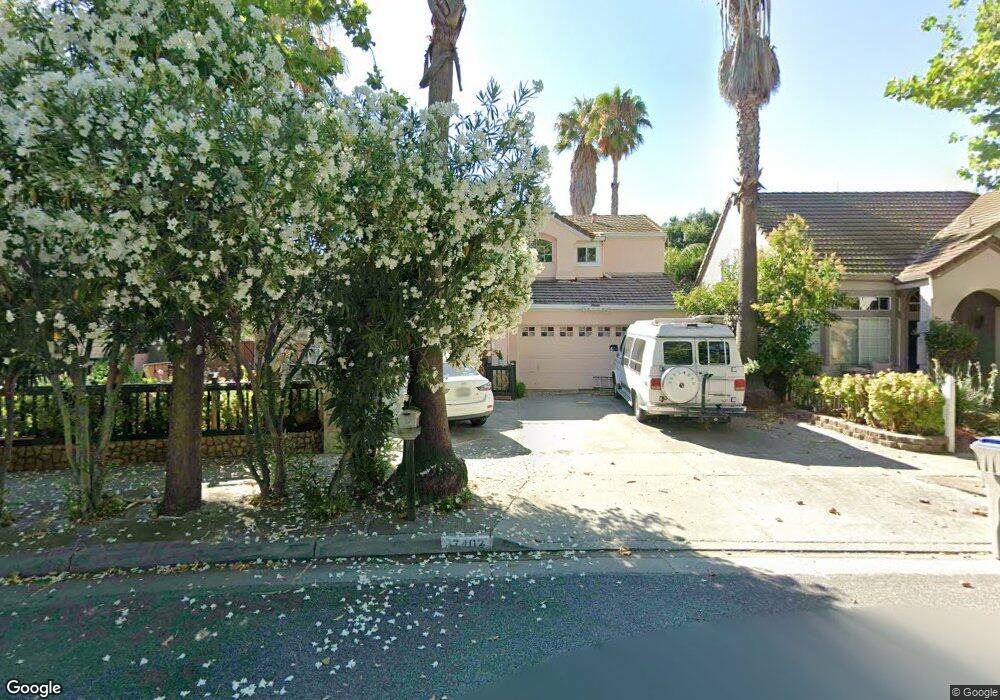
7402 Forsum Rd San Jose, CA 95138
Los Paseos NeighborhoodEstimated Value: $1,481,639 - $1,792,000
4
Beds
3
Baths
1,827
Sq Ft
$858/Sq Ft
Est. Value
About This Home
This home is located at 7402 Forsum Rd, San Jose, CA 95138 and is currently estimated at $1,568,410, approximately $858 per square foot. 7402 Forsum Rd is a home located in Santa Clara County with nearby schools including Los Paseos Elementary School, Martin Murphy Middle School, and Ann Sobrato High School.
Ownership History
Date
Name
Owned For
Owner Type
Purchase Details
Closed on
Jun 20, 2002
Sold by
Dong My Hua T and Dong My Huong T
Bought by
Nguyen Kiem and Dong My Huong T
Current Estimated Value
Home Financials for this Owner
Home Financials are based on the most recent Mortgage that was taken out on this home.
Original Mortgage
$487,500
Interest Rate
6.86%
Mortgage Type
Stand Alone First
Purchase Details
Closed on
Jul 29, 1997
Sold by
Glazer Amy E
Bought by
Dong My Hue T and Dong My Huong T
Home Financials for this Owner
Home Financials are based on the most recent Mortgage that was taken out on this home.
Original Mortgage
$260,000
Interest Rate
7.58%
Purchase Details
Closed on
Jul 28, 1997
Sold by
Nguyen Kiem
Bought by
Dong My Huong T
Home Financials for this Owner
Home Financials are based on the most recent Mortgage that was taken out on this home.
Original Mortgage
$260,000
Interest Rate
7.58%
Create a Home Valuation Report for This Property
The Home Valuation Report is an in-depth analysis detailing your home's value as well as a comparison with similar homes in the area
Home Values in the Area
Average Home Value in this Area
Purchase History
| Date | Buyer | Sale Price | Title Company |
|---|---|---|---|
| Nguyen Kiem | -- | Alliance Title Company | |
| Dong My Hue T | $325,000 | Fidelity National Title Co | |
| Dong My Huong T | -- | Fidelity National Title Co |
Source: Public Records
Mortgage History
| Date | Status | Borrower | Loan Amount |
|---|---|---|---|
| Previous Owner | Nguyen Kiem | $487,500 | |
| Previous Owner | Dong My Hue T | $260,000 |
Source: Public Records
Tax History Compared to Growth
Tax History
| Year | Tax Paid | Tax Assessment Tax Assessment Total Assessment is a certain percentage of the fair market value that is determined by local assessors to be the total taxable value of land and additions on the property. | Land | Improvement |
|---|---|---|---|---|
| 2025 | $10,950 | $755,701 | $261,494 | $494,207 |
| 2024 | $10,950 | $740,884 | $256,367 | $484,517 |
| 2023 | $10,753 | $726,358 | $251,341 | $475,017 |
| 2022 | $10,591 | $712,116 | $246,413 | $465,703 |
| 2021 | $10,283 | $698,154 | $241,582 | $456,572 |
| 2020 | $9,966 | $690,996 | $239,105 | $451,891 |
| 2019 | $10,147 | $677,448 | $234,417 | $443,031 |
| 2018 | $10,080 | $664,166 | $229,821 | $434,345 |
| 2017 | $9,971 | $651,144 | $225,315 | $425,829 |
| 2016 | $9,412 | $638,378 | $220,898 | $417,480 |
| 2015 | $9,301 | $628,790 | $217,580 | $411,210 |
| 2014 | $9,023 | $616,473 | $213,318 | $403,155 |
Source: Public Records
Map
Nearby Homes
- 45 Cheltenham Way
- 7392 Tulare Hill Dr
- 7237 Longhill Way
- 7260 Clear Vista Ct
- 133 Cheltenham Way
- 6986 Gregorich Dr Unit C
- 6958 Gregorich Dr Unit G
- 6945 Rodling Dr Unit C
- 202 French Ct
- 6901 Rodling Dr Unit D
- 7270 Alder Spring Way
- 6130 Monterey Rd Unit 201
- 6130 Monterey Rd Unit 289
- 6130 Monterey Rd Unit 9
- 6130 Monterey Rd Unit 159
- 6130 Monterey Rd Unit 316
- 1083 Esparanza Way
- 1075 Esparanza Way
- 1021 Chagall Way
- 7189 Rosencrans Way
- 7404 Forsum Rd
- 7406 Forsum Rd
- 7403 Forsum Rd
- 7405 Forsum Rd
- 104 Yasui Ct
- 102 Yasui Ct
- 100 Yasui Ct
- 105 Yasui Ct
- 103 Yasui Ct
- 101 Yasui Ct
- 11 Fortrose Ct
- 12 Uxbridge Ct
- 12 Fortrose Ct
- 11 Uxbridge Ct
- 14 Fortrose Ct
- 7401 Prindiville Dr
- 7399 Prindiville Dr
- 13 Fortrose Ct
- 7397 Prindiville Dr
- 13 Uxbridge Ct