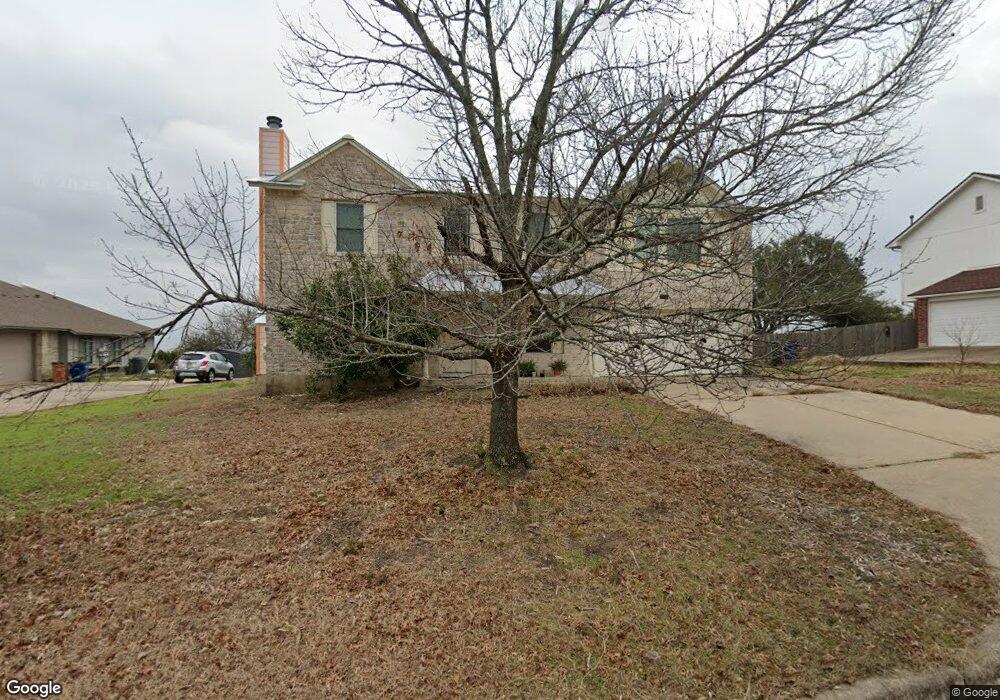
7405 Callbram Ln Austin, TX 78736
West Oak Hill NeighborhoodEstimated Value: $435,230 - $558,000
4
Beds
3
Baths
1,807
Sq Ft
$277/Sq Ft
Est. Value
About This Home
This home is located at 7405 Callbram Ln, Austin, TX 78736 and is currently estimated at $500,308, approximately $276 per square foot. 7405 Callbram Ln is a home located in Travis County with nearby schools including Patton Elementary School, Small Middle School, and James Bowie High School.
Ownership History
Date
Name
Owned For
Owner Type
Purchase Details
Closed on
Aug 18, 2009
Sold by
Leslie Charles
Bought by
Robbins Paul
Current Estimated Value
Home Financials for this Owner
Home Financials are based on the most recent Mortgage that was taken out on this home.
Original Mortgage
$141,600
Outstanding Balance
$92,230
Interest Rate
5.19%
Mortgage Type
New Conventional
Estimated Equity
$408,078
Purchase Details
Closed on
Mar 15, 2000
Sold by
Lindgren Robert J and Lindgren Lauren M
Bought by
Leslie Charles
Home Financials for this Owner
Home Financials are based on the most recent Mortgage that was taken out on this home.
Original Mortgage
$130,400
Interest Rate
8.23%
Purchase Details
Closed on
Aug 17, 1995
Sold by
Hunter Diana L and Hunter Diana Lee
Bought by
Lindgren Robert J
Home Financials for this Owner
Home Financials are based on the most recent Mortgage that was taken out on this home.
Original Mortgage
$99,200
Interest Rate
7.59%
Purchase Details
Closed on
May 25, 1995
Sold by
Hunter Frank J
Bought by
Hunter Diana L
Create a Home Valuation Report for This Property
The Home Valuation Report is an in-depth analysis detailing your home's value as well as a comparison with similar homes in the area
Home Values in the Area
Average Home Value in this Area
Purchase History
| Date | Buyer | Sale Price | Title Company |
|---|---|---|---|
| Robbins Paul | -- | None Available | |
| Leslie Charles | -- | -- | |
| Lindgren Robert J | -- | -- | |
| Hunter Diana L | -- | -- |
Source: Public Records
Mortgage History
| Date | Status | Borrower | Loan Amount |
|---|---|---|---|
| Open | Robbins Paul | $141,600 | |
| Previous Owner | Leslie Charles | $130,400 | |
| Previous Owner | Lindgren Robert J | $99,200 |
Source: Public Records
Tax History
| Year | Tax Paid | Tax Assessment Tax Assessment Total Assessment is a certain percentage of the fair market value that is determined by local assessors to be the total taxable value of land and additions on the property. | Land | Improvement |
|---|---|---|---|---|
| 2025 | $2,217 | $413,963 | $209,878 | $204,085 |
| 2023 | $2,324 | $388,415 | $0 | $0 |
| 2022 | $4,417 | $353,105 | $0 | $0 |
| 2021 | $7,148 | $321,005 | $132,000 | $189,005 |
| 2020 | $7,272 | $339,033 | $132,000 | $207,033 |
| 2018 | $6,483 | $292,820 | $132,000 | $195,923 |
| 2017 | $5,937 | $266,200 | $88,000 | $224,480 |
| 2016 | $5,397 | $242,000 | $88,000 | $212,216 |
| 2015 | $4,339 | $220,000 | $40,000 | $206,911 |
| 2014 | $4,339 | $200,000 | $40,000 | $160,000 |
Source: Public Records
Map
Nearby Homes
- 7701 Sika Rose Ln
- 8411 Bargamin Dr
- 7702 Fenton Cove
- 8507 Selway Dr
- 7502 Chelmsford Dr
- 8207 Mescalero Dr
- 8502 Hanbridge Ln
- 6901 Raccoon Run
- 8400 Candelaria Dr
- 8606 Thunderbird Rd Unit A & B
- 8402 Candelaria Dr
- 7012 Halesboro Dr
- 6718 Silvermine Dr Unit 103
- 6718 Silvermine Dr Unit 704
- 6718 Silvermine Dr Unit 1004
- 6718 Silvermine Dr Unit 302
- 7809 Old Bee Caves Rd Unit 16
- 7809 Old Bee Caves Rd Unit 17
- 7809 Old Bee Caves Rd Unit 18
- 6705 Covered Bridge Dr Unit 8
- 7403 Callbram Ln
- 7501 Callbram Ln
- 7503 Callbram Ln
- 7401 Callbram Ln
- 7406 Callbram Ln
- 7500 Callbram Ln
- 7404 Callbram Ln
- 7505 Callbram Ln
- 7305 Callbram Ln
- 7502 Callbram Ln
- 7400 Callbram Ln
- 7504 Callbram Ln
- 7507 Callbram Ln
- 7303 Callbram Ln
- 7506 Callbram Ln
- 7308 Callbram Ln
- 7904 Flintstone Cove
- 7509 Callbram Ln
- 7906 Flintstone Cove
- 7302 Callbram Ln
Your Personal Tour Guide
Ask me questions while you tour the home.