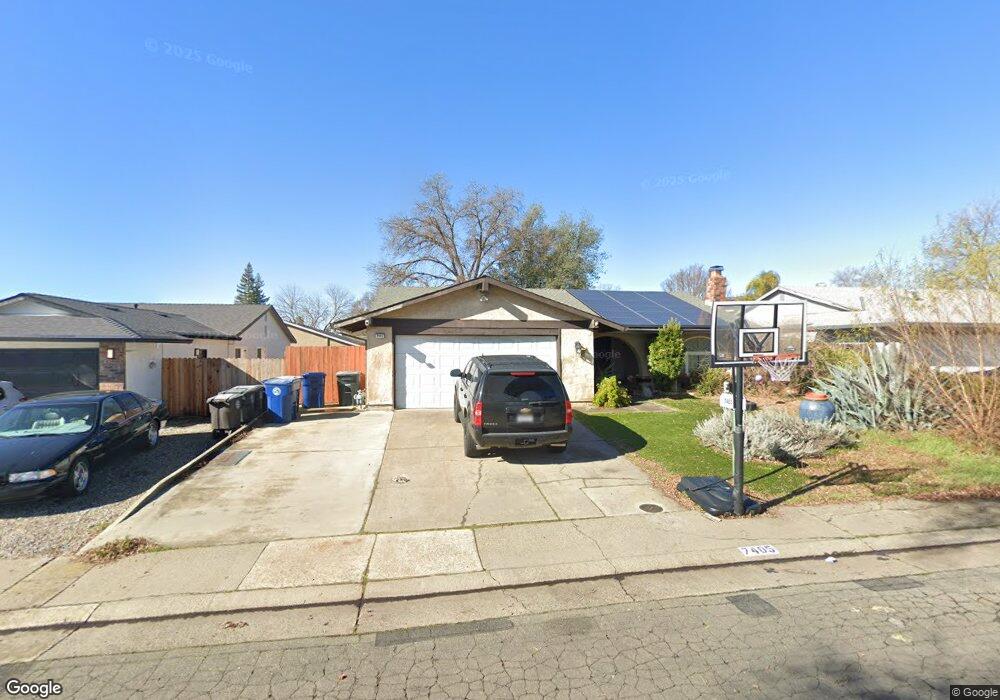
7405 Springvale Way Citrus Heights, CA 95621
Estimated Value: $474,000 - $509,000
4
Beds
2
Baths
1,502
Sq Ft
$326/Sq Ft
Est. Value
About This Home
This home is located at 7405 Springvale Way, Citrus Heights, CA 95621 and is currently estimated at $490,308, approximately $326 per square foot. 7405 Springvale Way is a home located in Sacramento County with nearby schools including Grand Oaks Elementary School, Sylvan Middle School, and Mesa Verde High School.
Ownership History
Date
Name
Owned For
Owner Type
Purchase Details
Closed on
Dec 2, 2011
Sold by
Cross Product Investments Llc
Bought by
Gori Frank T and Ocaranza Jinger
Current Estimated Value
Home Financials for this Owner
Home Financials are based on the most recent Mortgage that was taken out on this home.
Original Mortgage
$159,842
Outstanding Balance
$111,881
Interest Rate
4.5%
Mortgage Type
FHA
Estimated Equity
$378,427
Purchase Details
Closed on
May 31, 2011
Sold by
Barron Rafaela A
Bought by
Cross Product Investments Llc
Purchase Details
Closed on
May 28, 2003
Sold by
Barron Rafaela A and Manuel V & Rafaela A Barron Re
Bought by
Barron Rafaela A
Home Financials for this Owner
Home Financials are based on the most recent Mortgage that was taken out on this home.
Original Mortgage
$119,500
Interest Rate
5.75%
Mortgage Type
Purchase Money Mortgage
Purchase Details
Closed on
May 11, 2001
Sold by
Barron Manuel Venegas and Barron Rafaela A
Bought by
Barron Manuel V and Barron Rafaela A
Create a Home Valuation Report for This Property
The Home Valuation Report is an in-depth analysis detailing your home's value as well as a comparison with similar homes in the area
Home Values in the Area
Average Home Value in this Area
Purchase History
| Date | Buyer | Sale Price | Title Company |
|---|---|---|---|
| Gori Frank T | $164,000 | Fidelity National Title Co | |
| Cross Product Investments Llc | $128,300 | None Available | |
| Barron Rafaela A | -- | Financial Title Company | |
| Barron Manuel V | -- | -- |
Source: Public Records
Mortgage History
| Date | Status | Borrower | Loan Amount |
|---|---|---|---|
| Open | Gori Frank T | $159,842 | |
| Previous Owner | Barron Rafaela A | $119,500 |
Source: Public Records
Tax History Compared to Growth
Tax History
| Year | Tax Paid | Tax Assessment Tax Assessment Total Assessment is a certain percentage of the fair market value that is determined by local assessors to be the total taxable value of land and additions on the property. | Land | Improvement |
|---|---|---|---|---|
| 2025 | $4,171 | $205,982 | $106,759 | $99,223 |
| 2024 | $4,171 | $201,944 | $104,666 | $97,278 |
| 2023 | $4,619 | $197,985 | $102,614 | $95,371 |
| 2022 | $4,086 | $194,103 | $100,602 | $93,501 |
| 2021 | $4,046 | $190,298 | $98,630 | $91,668 |
| 2020 | $4,316 | $188,348 | $97,619 | $90,729 |
| 2019 | $4,543 | $184,655 | $95,705 | $88,950 |
| 2018 | $4,586 | $181,035 | $93,829 | $87,206 |
| 2017 | $3,909 | $177,487 | $91,990 | $85,497 |
| 2016 | $1,976 | $174,008 | $90,187 | $83,821 |
| 2015 | $1,941 | $171,395 | $88,833 | $82,562 |
| 2014 | $1,899 | $168,038 | $87,093 | $80,945 |
Source: Public Records
Map
Nearby Homes
- 6004 Windlass Ct
- 7401 Springvale Way
- 7448 Blackthorne Way
- 7439 Saybrook Dr
- 7225 Catamaran Dr
- 7516 Scaup Ln
- 7449 Mar Vista Way
- 5832 Alameda Ln Unit 138
- 7533 Pintail Cir
- 7428 White River Ln Unit 175
- 7101 Schooner Way
- 7128 Parkvale Way
- 7600 Golden Eye Ln Unit 43
- 6133 Glenhurst Way
- 7421 Topanga Ln Unit 264
- 5825 Hobbs Ln Unit 68
- 7236 Ojai Ct
- 7408 Azimuth Ln Unit 242
- 7324 Azimuth Ln Unit 19
- 6008 Cackler Ln Unit 88
- 7409 Springvale Way
- 7327 Parkvale Way
- 7401 Parkvale Way
- 7413 Springvale Way
- 7325 Parkvale Way
- 6020 Windlass Ct
- 6016 Windlass Ct
- 7410 Springvale Way
- 7336 Parkvale Way
- 7332 Parkvale Way
- 7405 Parkvale Way
- 7340 Parkvale Way
- 7417 Springvale Way
- 7321 Parkvale Way
- 7328 Parkvale Way
- 7421 Springvale Way
- 7400 Parkvale Way
- 6012 Windlass Ct
- 6024 Windlass Ct
- 7426 Springvale Way