
7407 Jarnecke Ave Hammond, IN 46324
Estimated payment $1,148/month
Highlights
- No HOA
- Patio
- Tile Flooring
- Neighborhood Views
- Living Room
- Outdoor Storage
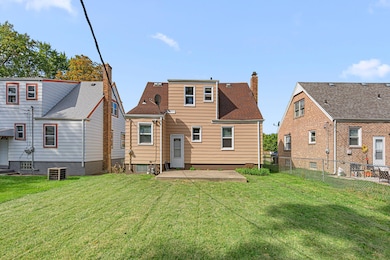
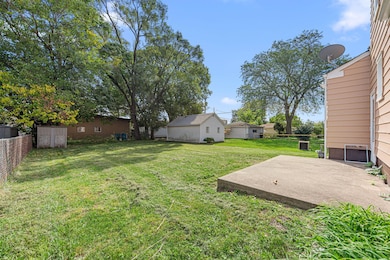
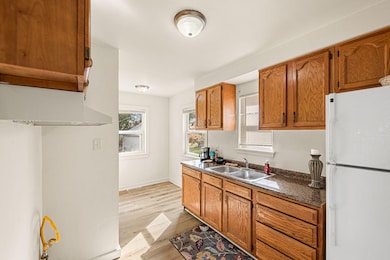
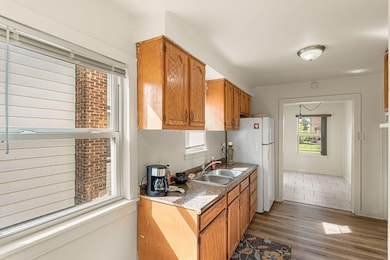
About This Home
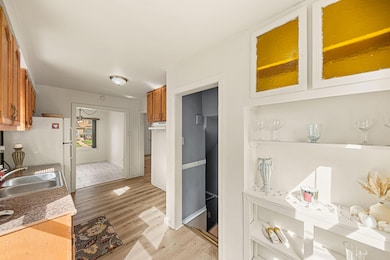
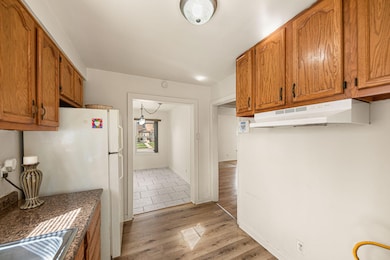
REDUCED PRICE! South Hammond cape cod features convenient main level bedroom and full bath! Eat in kitchen with built in china cabinet and formal dining room right off kitchen. Walk upstairs to office den area and 2 additional large size bedrooms with huge closets. Great location! Close to the train station! Perfect starter home or investment! Spacious floor plan includes full basement. Tiled foyer entrance. Professionally painted exterior 2025! Updated water heater 5 years. Updated bathroom in great condition! Potential living area in semi finished basement with 3/4 finished bathroom. Large laundry area includes sink. Deep lot that is partially fenced with concrete patio. Enjoy backyard entertaining and large enough for a future garage. Being sold as is. 13 Month Home Warranty included! Taxes will be reduced once exemption is filed! Tax credit for 2026 bill will be reflected at closing. Convenient location to express way and Chicago. First time home buyers programs available. Needs some TLC to make it your ideal home. Don't wait set up your showing today! BONUS-5,000 credit to buyer for closing costs and pre paid items. Don't miss this opportunity!!
Home Details
Home Type
- Single Family
Est. Annual Taxes
- $3,150
Year Built
- Built in 1949
Lot Details
- 5,227 Sq Ft Lot
- Partially Fenced Property
Interior Spaces
- 1.5-Story Property
- Insulated Windows
- Blinds
- Living Room
- Dining Room
- Tile Flooring
- Neighborhood Views
- Natural lighting in basement
- Gas Range
Bedrooms and Bathrooms
- 3 Bedrooms
Laundry
- Sink Near Laundry
- Washer and Gas Dryer Hookup
Outdoor Features
- Patio
- Outdoor Storage
Schools
- Frank O'bannon Elementary School
- Hammond Central High School
Utilities
- No Cooling
- Forced Air Heating System
- Heating System Uses Natural Gas
Community Details
- No Home Owners Association
- Ford Roxana Add Subdivision
Listing and Financial Details
- Assessor Parcel Number 450718133002000023
Map
Home Values in the Area
Average Home Value in this Area
Tax History
| Year | Tax Paid | Tax Assessment Tax Assessment Total Assessment is a certain percentage of the fair market value that is determined by local assessors to be the total taxable value of land and additions on the property. | Land | Improvement |
|---|---|---|---|---|
| 2024 | $6,190 | $142,500 | $22,200 | $120,300 |
| 2023 | $3,477 | $129,500 | $22,200 | $107,300 |
| 2022 | $3,259 | $121,600 | $22,200 | $99,400 |
| 2021 | $2,849 | $105,100 | $17,100 | $88,000 |
| 2020 | $2,451 | $89,800 | $17,100 | $72,700 |
| 2019 | $2,522 | $86,200 | $17,100 | $69,100 |
| 2018 | $2,599 | $81,400 | $17,100 | $64,300 |
| 2017 | $2,638 | $72,000 | $17,100 | $54,900 |
| 2016 | $2,225 | $70,000 | $17,100 | $52,900 |
| 2014 | $2,252 | $71,900 | $17,100 | $54,800 |
| 2013 | $2,052 | $69,200 | $17,100 | $52,100 |
Property History
| Date | Event | Price | List to Sale | Price per Sq Ft |
|---|---|---|---|---|
| 11/24/2025 11/24/25 | Price Changed | $167,500 | -2.9% | $78 / Sq Ft |
| 11/02/2025 11/02/25 | Price Changed | $172,500 | -4.2% | $80 / Sq Ft |
| 10/18/2025 10/18/25 | Price Changed | $180,000 | -5.3% | $84 / Sq Ft |
| 10/03/2025 10/03/25 | For Sale | $190,000 | -- | $88 / Sq Ft |
Purchase History
| Date | Type | Sale Price | Title Company |
|---|---|---|---|
| Warranty Deed | -- | None Listed On Document | |
| Quit Claim Deed | -- | None Available | |
| Special Warranty Deed | -- | None Available | |
| Sheriffs Deed | $51,100 | None Available | |
| Warranty Deed | -- | Counselors Title Co Llc | |
| Quit Claim Deed | -- | -- |
Mortgage History
| Date | Status | Loan Amount | Loan Type |
|---|---|---|---|
| Previous Owner | $97,000 | Fannie Mae Freddie Mac |
Source: Northwest Indiana Association of REALTORS®
MLS Number: 828798
APN: 45-07-18-133-002.000-023
Disclaimer: Certain information contained herein is derived from information provided by parties other than Homes.com. All information provided is deemed reliable, but is not guaranteed to be accurate and should be independently verified.
![]() Copyright 2025 MuItiple Listing Service of the Northwest Indiana Realtors Association Multiple Listing Service (NIRA MLS). All rights reserved. IDX information is provided exclusively for personal, non-commercial use, and may not be used for any purpose other than to identify prospective properties consumers may be interested in purchasing. Information is deemed reliable but not guaranteed.
Copyright 2025 MuItiple Listing Service of the Northwest Indiana Realtors Association Multiple Listing Service (NIRA MLS). All rights reserved. IDX information is provided exclusively for personal, non-commercial use, and may not be used for any purpose other than to identify prospective properties consumers may be interested in purchasing. Information is deemed reliable but not guaranteed.
- 7426 Howard Ave
- 7319 Oakdale Ave
- 7335 Tapper Ave
- 937 174th Place
- 7609 Jarnecke Ave
- 939 175th Place
- 7537 Catalpa Ave
- 7324 Walnut Ave
- 7230 Mclaughlin Ave
- 1012 177th Place
- 1221 E 170th Place
- 1015 River Dr
- 1308 170th St
- 7728 Beech Ave
- 7019 Chestnut Ave
- 7437 White Oak Ave
- 7449 White Oak Ave
- 1615 175th St
- 7212 Southeastern Ave
- 7509 Jackson Ave
- 7603 Jarnecke Ave
- 7528 Catalpa Ave
- 7325 Linden Place
- 7537 Birch Ave
- 8013 Monaldi Dr
- 7843 Jackson Ave
- 325 Fairbanks Place
- 7611 Kinsley Place
- 6634 Harrison Ave Unit North
- 1936 167th St
- 32 166th Place
- 27 164th Place
- 2217 Tanglewood Dr
- 17053 Grant St
- 1512 Lincoln Place
- 1380 Wentworth Ave
- 1376 Wentworth Ave
- 18333 Wentworth Ave Unit 7
- 18329 West St Unit 2
- 18428 Lange St
