C
Landlord's Agent in 2012
Catherine Bowen
RE/Sys
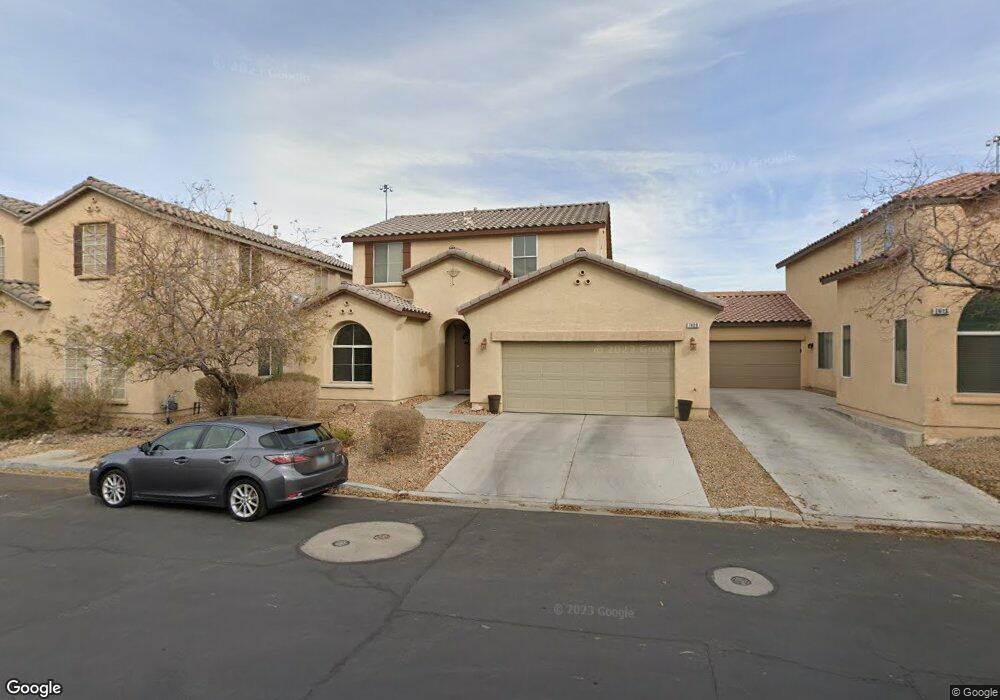
Estimated Value: $421,127 - $472,000
SPA AND BUILT-IN BBQ! 2 STORY HOME WITH OPEN FLOOR PLAN, 3 BEDROOMS, 2.5 BATHS, 2 CAR GARAGE, KITCHEN WITH ARCHED WINDOW, BREAKFAST BAR, ALL APPLIANCES INCLUDED, DESERT LANDSCAPED WITH PATIO. TENANTS TO VERIFY ALL FACTS AND FIGURES.
Last Agent to Rent the Property
Catherine Bowen
RE/Sys License #S.0072491 Listed on: 07/11/2012
Last Renter's Agent
Dominic Weigel
Executive Realty Services License #S.0060953
| Date | Buyer | Sale Price | Title Company |
|---|---|---|---|
| Ryan Evans Foundation Inc | $417,500 | Roc Title | |
| Turner David John | $219,900 | Fidelity National Title | |
| Dlj Mortgage Capital Inc | $268,011 | Fidelity National Title Agen | |
| Sonego Yvonne | $315,765 | Stewart Title Of Nevada |
| Date | Status | Borrower | Loan Amount |
|---|---|---|---|
| Previous Owner | Turner David John | $197,910 | |
| Previous Owner | Sonego Yvonne | $252,600 |
| Date | Event | Price | List to Sale | Price per Sq Ft |
|---|---|---|---|---|
| 07/11/2012 07/11/12 | For Rent | $1,195 | 0.0% | -- |
| 07/11/2012 07/11/12 | Rented | $1,195 | -- | -- |
| Year | Tax Paid | Tax Assessment Tax Assessment Total Assessment is a certain percentage of the fair market value that is determined by local assessors to be the total taxable value of land and additions on the property. | Land | Improvement |
|---|---|---|---|---|
| 2025 | $2,117 | $110,606 | $35,700 | $74,906 |
| 2024 | $1,961 | $110,606 | $35,700 | $74,906 |
| 2023 | $1,961 | $103,070 | $32,200 | $70,870 |
| 2022 | $2,096 | $93,163 | $28,700 | $64,463 |
| 2021 | $2,206 | $86,132 | $24,850 | $61,282 |
| 2020 | $1,559 | $84,482 | $23,800 | $60,682 |
| 2019 | $1,461 | $81,535 | $22,050 | $59,485 |
| 2018 | $1,394 | $74,870 | $17,850 | $57,020 |
| 2017 | $2,217 | $75,600 | $17,850 | $57,750 |
| 2016 | $1,558 | $62,273 | $14,000 | $48,273 |
| 2015 | $1,555 | $47,702 | $9,800 | $37,902 |
| 2014 | $1,516 | $41,825 | $7,000 | $34,825 |
C
Landlord's Agent in 2012
Catherine Bowen
RE/Sys
D
Tenant's Agent in 2012
Dominic Weigel
Executive Realty Services
Source: Las Vegas REALTORS®
MLS Number: 1266301
APN: 177-10-516-045
Disclaimer: Certain information contained herein is derived from information provided by parties other than Homes.com. All information provided is deemed reliable, but is not guaranteed to be accurate and should be independently verified.
![]() The data relating to real estate for sale on this web site comes in part from the INTERNET DATA EXCHANGE Program of the Greater Las Vegas Association of REALTORS® MLS. Real estate listings held by brokerage firms other than this site owner are marked with the IDX logo. Information is deemed reliable but not guaranteed. Copyright 2025 of the Greater Las Vegas Association of REALTORS® MLS. All rights reserved.
The data relating to real estate for sale on this web site comes in part from the INTERNET DATA EXCHANGE Program of the Greater Las Vegas Association of REALTORS® MLS. Real estate listings held by brokerage firms other than this site owner are marked with the IDX logo. Information is deemed reliable but not guaranteed. Copyright 2025 of the Greater Las Vegas Association of REALTORS® MLS. All rights reserved.
