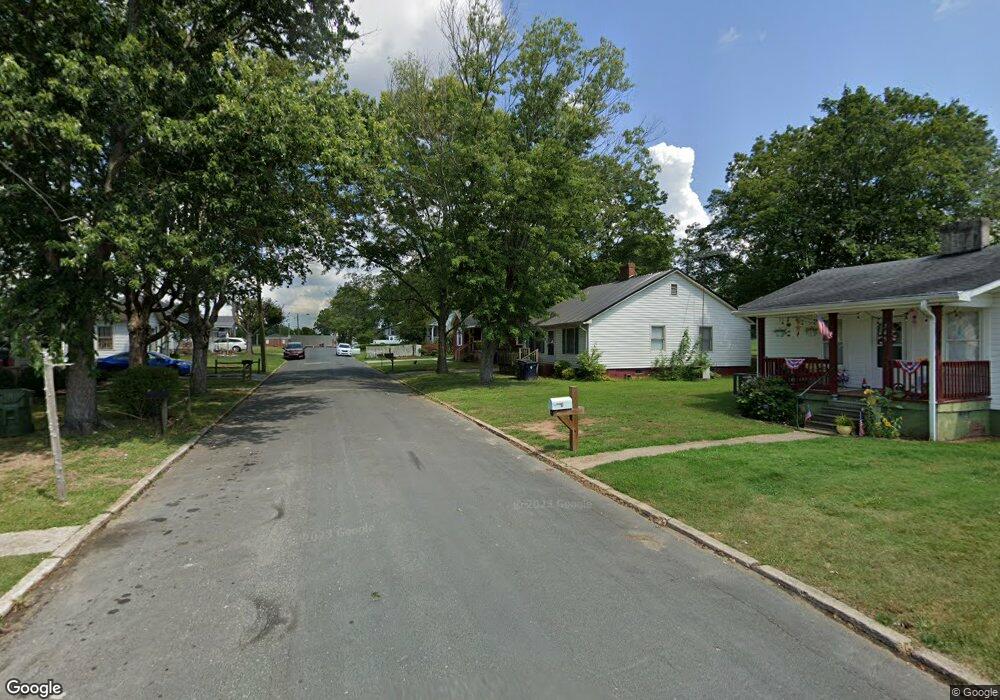
741 2nd Rainbow St Lexington, NC 27295
Estimated Value: $121,000 - $171,000
3
Beds
2
Baths
1,174
Sq Ft
$122/Sq Ft
Est. Value
About This Home
This home is located at 741 2nd Rainbow St, Lexington, NC 27295 and is currently estimated at $142,730, approximately $121 per square foot. 741 2nd Rainbow St is a home located in Davidson County with nearby schools including South Lexington School, Lexington Middle School, and Lexington Senior High School.
Ownership History
Date
Name
Owned For
Owner Type
Purchase Details
Closed on
Apr 30, 2024
Sold by
Wt Hedrick Properties Llc
Bought by
Highrock Properties Enterprises Llc
Current Estimated Value
Purchase Details
Closed on
Jun 21, 2022
Sold by
Hedrick and Wendy
Bought by
Wt Hedrick Properties Llc
Purchase Details
Closed on
Nov 22, 2016
Sold by
Christensen Lisa M
Bought by
Hedrick Thad
Purchase Details
Closed on
Feb 8, 2008
Sold by
Hill Clint E and Hill Darlene L
Bought by
Christensen Michael J and Christensen Lisa M
Home Financials for this Owner
Home Financials are based on the most recent Mortgage that was taken out on this home.
Original Mortgage
$20,720
Interest Rate
6.17%
Mortgage Type
Purchase Money Mortgage
Purchase Details
Closed on
Oct 10, 2007
Sold by
Futrell Joretta P and Futrell Richard Alton
Bought by
Hill Clint E and Hill Darlene L
Purchase Details
Closed on
Oct 1, 1997
Create a Home Valuation Report for This Property
The Home Valuation Report is an in-depth analysis detailing your home's value as well as a comparison with similar homes in the area
Home Values in the Area
Average Home Value in this Area
Purchase History
| Date | Buyer | Sale Price | Title Company |
|---|---|---|---|
| Highrock Properties Enterprises Llc | -- | None Listed On Document | |
| Wt Hedrick Properties Llc | -- | Brinkley Walser Stoner Pllc | |
| Hedrick Thad | $18,000 | None Available | |
| Christensen Michael J | $26,000 | None Available | |
| Hill Clint E | $26,000 | Chicago Title Insurance Co | |
| -- | $22,500 | -- |
Source: Public Records
Mortgage History
| Date | Status | Borrower | Loan Amount |
|---|---|---|---|
| Previous Owner | Christensen Michael J | $20,720 |
Source: Public Records
Tax History Compared to Growth
Tax History
| Year | Tax Paid | Tax Assessment Tax Assessment Total Assessment is a certain percentage of the fair market value that is determined by local assessors to be the total taxable value of land and additions on the property. | Land | Improvement |
|---|---|---|---|---|
| 2025 | $1,086 | $83,500 | $0 | $0 |
| 2024 | $1,086 | $83,500 | $0 | $0 |
| 2023 | $1,094 | $83,500 | $0 | $0 |
| 2022 | $1,086 | $83,500 | $0 | $0 |
| 2021 | $354 | $27,240 | $0 | $0 |
| 2020 | $311 | $24,120 | $0 | $0 |
| 2019 | $316 | $24,120 | $0 | $0 |
| 2018 | $316 | $24,120 | $0 | $0 |
| 2017 | $316 | $24,120 | $0 | $0 |
| 2016 | $316 | $24,120 | $0 | $0 |
| 2015 | $304 | $24,120 | $0 | $0 |
| 2014 | $354 | $28,070 | $0 | $0 |
Source: Public Records
Map
Nearby Homes
- 739 2nd Rainbow St
- 1400 Second Rainbow St
- 743 2nd Rainbow St
- 715 1st Rainbow St
- 745 2nd Rainbow St
- 737 2nd Rainbow St
- 717 1st Rainbow St
- 742 2nd Rainbow St
- 713 1st Rainbow St
- 744 2nd Rainbow St
- 740 2nd Rainbow St
- 747 2nd Rainbow St
- 735 2nd Rainbow St
- 738 2nd Rainbow St
- 746 2nd Rainbow St
- 719 1st Rainbow St
- 719 1st Rainbow St Unit Erlanger Mills Inc P
- 711 1st Rainbow St
- 749 2nd Rainbow St
- 733 2nd Rainbow St