741 Acorn Ct Unit C2 Bartlett, IL 60103
Estimated Value: $196,000 - $241,000
2
Beds
2
Baths
387,700
Sq Ft
$1/Sq Ft
Est. Value
About This Home
This home is located at 741 Acorn Ct Unit C2, Bartlett, IL 60103 and is currently estimated at $223,084, approximately $0 per square foot. 741 Acorn Ct Unit C2 is a home located in Cook County with nearby schools including Bartlett Elementary School, Eastview Middle School, and South Elgin High School.
Ownership History
Date
Name
Owned For
Owner Type
Purchase Details
Closed on
Mar 14, 2008
Sold by
Skrobish Douglas E and Gray Tommy J
Bought by
Hochstetter Brian J
Current Estimated Value
Home Financials for this Owner
Home Financials are based on the most recent Mortgage that was taken out on this home.
Original Mortgage
$129,174
Outstanding Balance
$80,689
Interest Rate
5.79%
Mortgage Type
FHA
Estimated Equity
$142,395
Purchase Details
Closed on
Jun 17, 2006
Sold by
Skrobish Douglas E
Bought by
Skrobish Douglas E and Gray Tommy J
Purchase Details
Closed on
Nov 4, 2002
Sold by
Behrens Debra L and Estate Of Raymond H Huss
Bought by
Skrobish Douglas E
Home Financials for this Owner
Home Financials are based on the most recent Mortgage that was taken out on this home.
Original Mortgage
$96,000
Interest Rate
6.1%
Create a Home Valuation Report for This Property
The Home Valuation Report is an in-depth analysis detailing your home's value as well as a comparison with similar homes in the area
Home Values in the Area
Average Home Value in this Area
Purchase History
| Date | Buyer | Sale Price | Title Company |
|---|---|---|---|
| Hochstetter Brian J | $131,000 | Multiple | |
| Skrobish Douglas E | -- | Cti | |
| Skrobish Douglas E | $120,000 | -- |
Source: Public Records
Mortgage History
| Date | Status | Borrower | Loan Amount |
|---|---|---|---|
| Open | Hochstetter Brian J | $129,174 | |
| Previous Owner | Skrobish Douglas E | $96,000 | |
| Closed | Skrobish Douglas E | $18,000 |
Source: Public Records
Tax History Compared to Growth
Tax History
| Year | Tax Paid | Tax Assessment Tax Assessment Total Assessment is a certain percentage of the fair market value that is determined by local assessors to be the total taxable value of land and additions on the property. | Land | Improvement |
|---|---|---|---|---|
| 2024 | $4,049 | $12,794 | $519 | $12,275 |
| 2023 | $3,913 | $12,794 | $519 | $12,275 |
| 2022 | $3,913 | $12,794 | $519 | $12,275 |
| 2021 | $3,377 | $9,087 | $441 | $8,646 |
| 2020 | $3,332 | $9,087 | $441 | $8,646 |
| 2019 | $3,348 | $10,211 | $441 | $9,770 |
| 2018 | $2,429 | $6,794 | $389 | $6,405 |
| 2017 | $2,388 | $6,794 | $389 | $6,405 |
| 2016 | $2,230 | $6,794 | $389 | $6,405 |
| 2015 | $1,931 | $5,445 | $337 | $5,108 |
| 2014 | $1,907 | $5,445 | $337 | $5,108 |
| 2013 | $1,833 | $5,445 | $337 | $5,108 |
Source: Public Records
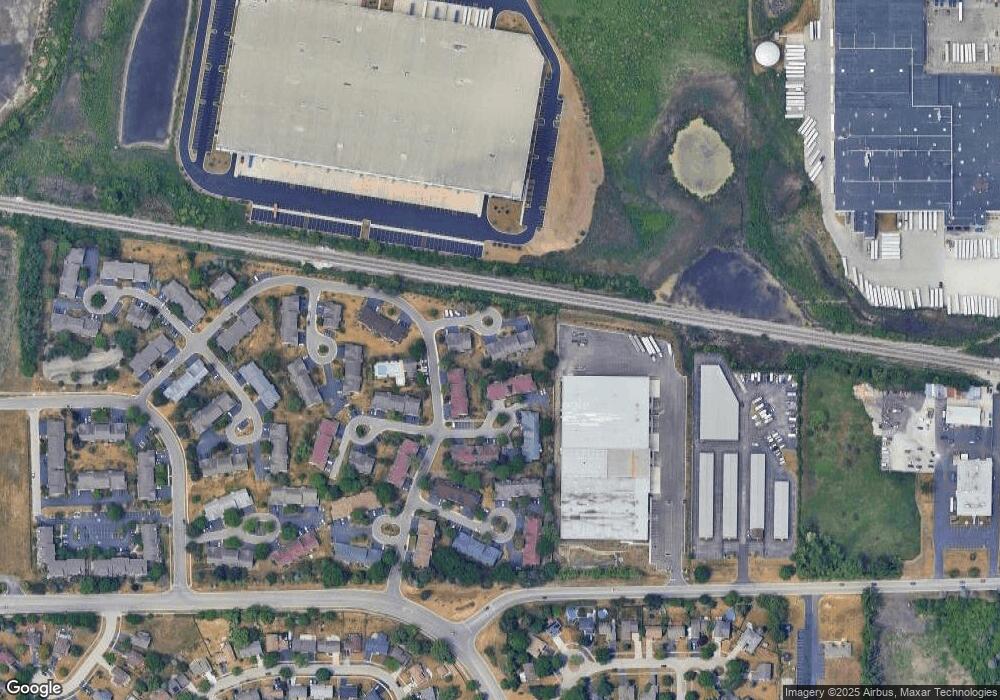
Map
Nearby Homes
- 748 Sterling Ct Unit A2
- 652 Mallard Ct Unit C1
- 387 Wilmington Dr Unit C
- 747 Cove Ct
- 853 Voyager Dr
- 145 Ann Ct Unit A
- 27W607 Devon Ave
- 334 Joan Ct Unit B
- 179 Rita Ct Unit D
- 119 E Railroad Ave
- 923 Capistrano Terrace
- 937 Sandpiper Ct
- 2187 Walnut Ave
- 110 N Chase Ave
- 6881 Hickory St
- 6551 Center Ave
- 6988 Plumtree Ln
- 275 E Railroad Ave Unit 301
- 275 E Railroad Ave Unit 101
- 271 E Railroad Ave Unit 302
- 741 Acorn Ct Unit D1
- 741 Acorn Ct Unit D2
- 741 Acorn Ct Unit C1
- 749 Acorn Ct Unit 16B21
- 749 Acorn Ct Unit 16B11
- 749 Acorn Ct Unit A1
- 749 Acorn Ct
- 748 Sterling Ct Unit B1
- 748 Sterling Ct Unit 13B21
- 748 Sterling Ct Unit B2
- 748 Sterling Ct
- 748 Sterling Ct Unit 1A
- 756 Sterling Ct
- 756 Sterling Ct Unit 13B22
- 756 Sterling Ct Unit C1
- 756 Sterling Ct Unit D2
- 756 Sterling Ct Unit D1
- 756 Sterling Ct Unit C2
- 333 Newport Ln Unit A2
- 333 Newport Ln Unit 14A11