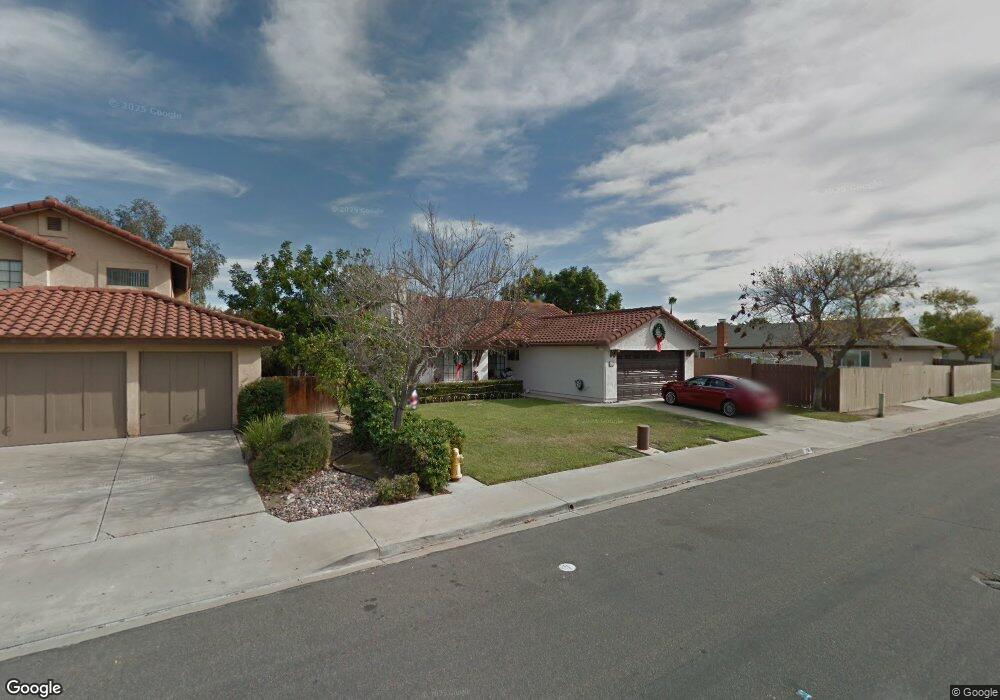
741 Baylor Ave Bonita, CA 91902
Bonita Long Canyon NeighborhoodEstimated Value: $810,543 - $1,032,000
3
Beds
2
Baths
1,516
Sq Ft
$643/Sq Ft
Est. Value
About This Home
This home is located at 741 Baylor Ave, Bonita, CA 91902 and is currently estimated at $974,636, approximately $642 per square foot. 741 Baylor Ave is a home located in San Diego County with nearby schools including Burton C. Tiffany Elementary School, Bonita Vista Middle School, and Bonita Vista Senior High School.
Ownership History
Date
Name
Owned For
Owner Type
Purchase Details
Closed on
Jan 8, 2024
Sold by
Germond Taryn
Bought by
Taryn Germond & James Najera Family Trust and Germond
Current Estimated Value
Purchase Details
Closed on
Feb 20, 2018
Sold by
Germond Taryn and Estate Of James Pellum Curtis
Bought by
Germond Taryn
Purchase Details
Closed on
Jul 8, 2014
Sold by
Germond Celia Benson
Bought by
Germond Celia Benson and Celia B Germond Trust
Purchase Details
Closed on
Jul 1, 2014
Sold by
Germond Celia B
Bought by
Germond Celia Benson and Curtis James Pellum
Purchase Details
Closed on
Jun 1, 2010
Sold by
Curtis Betty J
Bought by
Curtis Betty J and Germond Celia B
Purchase Details
Closed on
Jun 6, 2001
Sold by
Curtis Betty J and Curtis Trust
Bought by
Curtis Betty J and Curtis Trust
Purchase Details
Closed on
Oct 29, 1986
Create a Home Valuation Report for This Property
The Home Valuation Report is an in-depth analysis detailing your home's value as well as a comparison with similar homes in the area
Home Values in the Area
Average Home Value in this Area
Purchase History
| Date | Buyer | Sale Price | Title Company |
|---|---|---|---|
| Taryn Germond & James Najera Family Trust | -- | None Listed On Document | |
| Germond Taryn | -- | None Available | |
| Germond Celia Benson | -- | None Available | |
| Germond Celia Benson | -- | None Available | |
| Curtis Betty J | -- | None Available | |
| Curtis Betty J | -- | -- | |
| -- | $144,900 | -- |
Source: Public Records
Tax History Compared to Growth
Tax History
| Year | Tax Paid | Tax Assessment Tax Assessment Total Assessment is a certain percentage of the fair market value that is determined by local assessors to be the total taxable value of land and additions on the property. | Land | Improvement |
|---|---|---|---|---|
| 2025 | $4,838 | $374,258 | $172,997 | $201,261 |
| 2024 | $4,838 | $366,920 | $169,605 | $197,315 |
| 2023 | $4,760 | $359,727 | $166,280 | $193,447 |
| 2022 | $4,618 | $352,674 | $163,020 | $189,654 |
| 2021 | $4,519 | $345,760 | $159,824 | $185,936 |
| 2020 | $4,416 | $342,216 | $158,186 | $184,030 |
| 2019 | $4,304 | $335,507 | $155,085 | $180,422 |
| 2018 | $4,230 | $328,930 | $152,045 | $176,885 |
| 2017 | $13 | $322,481 | $149,064 | $173,417 |
| 2016 | $3,166 | $238,947 | $69,533 | $169,414 |
| 2015 | $3,121 | $235,359 | $68,489 | $166,870 |
| 2014 | $3,069 | $230,750 | $67,148 | $163,602 |
Source: Public Records
Map
Nearby Homes
- 731 Baylor Ave
- 1665 Yale St
- 1415 Summit Dr
- 1761 Harvard St
- 1579 Apache Dr Unit E
- 1370 Callejon Palacios Unit 61
- 575 Otay Lakes Rd Unit 44
- 575 Otay Lakes Rd
- 575 Otay Lakes Rd Unit 26
- 1567 Apache Dr Unit A
- 1386 Serena Cir Unit 2
- 1529 Apache Dr Unit A
- 678 Rue Avallon
- 1532 Apache Dr Unit D
- 609 Rue Bayonne
- 376 Canyon Ridge Dr
- 4334 Corral Canyon Rd
- 1950 Rue Michelle
- 1626 Coolsprings Ct
- 1633 Quailsprings Ct
- 739 Baylor Ave
- 1607 Mills St
- 1611 Mills St
- 737 Baylor Ave
- 740 Baylor Ave
- 1615 Mills St
- 738 Baylor Ave
- 742 Baylor Ave
- 735 Baylor Ave
- 736 Baylor Ave
- 748 Baylor Ave
- 1619 Mills St
- 754 Redlands Place
- 734 Baylor Ave
- 760 Redlands Place
- 748 Redlands Place
- 733 Baylor Ave
- 754 Baylor Ave
- 1606 Mills St
- 1610 Mills St