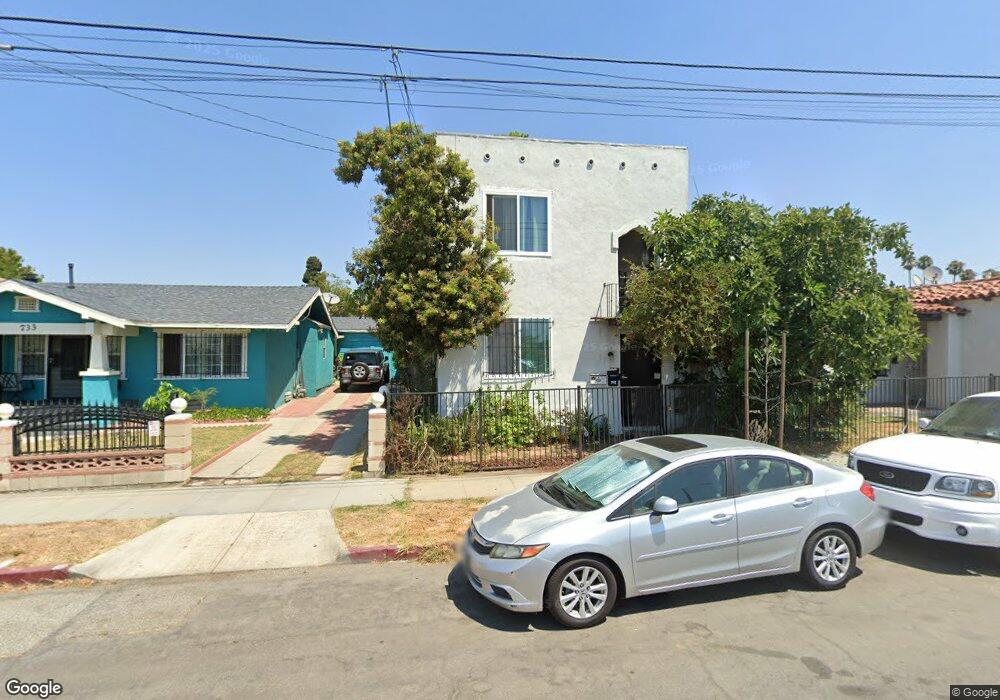
741 E Burnett St Long Beach, CA 90806
Sunrise NeighborhoodEstimated Value: $753,000 - $902,000
3
Beds
3
Baths
2,475
Sq Ft
$328/Sq Ft
Est. Value
About This Home
This home is located at 741 E Burnett St, Long Beach, CA 90806 and is currently estimated at $812,667, approximately $328 per square foot. 741 E Burnett St is a home located in Los Angeles County with nearby schools including Bobbie Smith Elementary, Nelson Academy, and Long Beach Polytechnic High School.
Ownership History
Date
Name
Owned For
Owner Type
Purchase Details
Closed on
Jan 8, 2020
Sold by
Contreras Javier and Contreras Javier
Bought by
Nguyen Dongsa and Vo Hoa
Current Estimated Value
Home Financials for this Owner
Home Financials are based on the most recent Mortgage that was taken out on this home.
Original Mortgage
$486,500
Outstanding Balance
$429,842
Interest Rate
3.6%
Mortgage Type
New Conventional
Estimated Equity
$382,825
Purchase Details
Closed on
Dec 11, 2003
Sold by
Roman Juan Pablo and Hernandez Dolores
Bought by
Navarro Isaias
Purchase Details
Closed on
Feb 25, 1994
Sold by
World S & L Assn
Bought by
Padilla Veronica A
Home Financials for this Owner
Home Financials are based on the most recent Mortgage that was taken out on this home.
Original Mortgage
$97,580
Interest Rate
6.98%
Purchase Details
Closed on
Dec 7, 1993
Sold by
Golden West Svgs Assn Service Co
Bought by
World S & L Assn
Create a Home Valuation Report for This Property
The Home Valuation Report is an in-depth analysis detailing your home's value as well as a comparison with similar homes in the area
Home Values in the Area
Average Home Value in this Area
Purchase History
| Date | Buyer | Sale Price | Title Company |
|---|---|---|---|
| Nguyen Dongsa | -- | Lawyers Title Company | |
| Contreras Javier | -- | Lawyers Title Company | |
| Navarro Isaias | -- | -- | |
| Padilla Veronica A | $119,000 | -- | |
| World S & L Assn | $173,100 | Stewart Title |
Source: Public Records
Mortgage History
| Date | Status | Borrower | Loan Amount |
|---|---|---|---|
| Open | Nguyen Dongsa | $486,500 | |
| Previous Owner | Padilla Veronica A | $97,580 |
Source: Public Records
Tax History
| Year | Tax Paid | Tax Assessment Tax Assessment Total Assessment is a certain percentage of the fair market value that is determined by local assessors to be the total taxable value of land and additions on the property. | Land | Improvement |
|---|---|---|---|---|
| 2025 | $7,026 | $522,987 | $260,240 | $262,747 |
| 2024 | $7,026 | $512,734 | $255,138 | $257,596 |
| 2023 | $11,245 | $851,451 | $420,470 | $430,981 |
| 2022 | $10,558 | $834,757 | $412,226 | $422,531 |
| 2021 | $4,356 | $315,597 | $158,584 | $157,013 |
| 2020 | $4,344 | $312,362 | $156,958 | $155,404 |
| 2019 | $4,295 | $306,238 | $153,881 | $152,357 |
| 2018 | $4,127 | $300,234 | $150,864 | $149,370 |
| 2016 | $3,792 | $288,577 | $145,006 | $143,571 |
| 2015 | $3,647 | $284,243 | $142,828 | $141,415 |
| 2014 | $3,636 | $278,676 | $140,031 | $138,645 |
Source: Public Records
Map
Nearby Homes
- 1000 E Burnett St
- 2366 Linden Ave
- 2310 Elm Ave
- 2123 Atlantic Ave
- 2320 Locust Ave
- 1030 E 21st St
- 2093 Pasadena Ave
- 410 E 21st St
- 1204 E Smith Place
- 2285 Earl Ave
- 1211 E Leigh Ct
- 2553 Pine Ave
- 2599 Walnut Ave
- 2599 Walnut Ave Unit 135
- 2341 Walnut Ave
- 1941 Olive Ave
- 1339 E Wesley Dr
- 2369 Pacific Ave
- 925 E 19th St
- 2240 Walnut Ave
- 733 E Burnett St
- 725 E Burnett St
- 2393 Olive Ave
- 2396 Olive Ave
- 832 E Sunrise Blvd
- 822 E Sunrise Blvd
- 721 E Burnett St
- 2385 Olive Ave
- 2390 Olive Ave
- 810 E Sunrise Blvd
- 836 E Sunrise Blvd
- 714 E Burnett St
- 808 E Sunrise Blvd
- 2380 Olive Ave
- 802 E Sunrise Blvd
- 2373 Olive Ave
- 709 E Burnett St
- 710 E Burnett St
- 2372 Olive Ave
- 815 E Eagle St
Your Personal Tour Guide
Ask me questions while you tour the home.