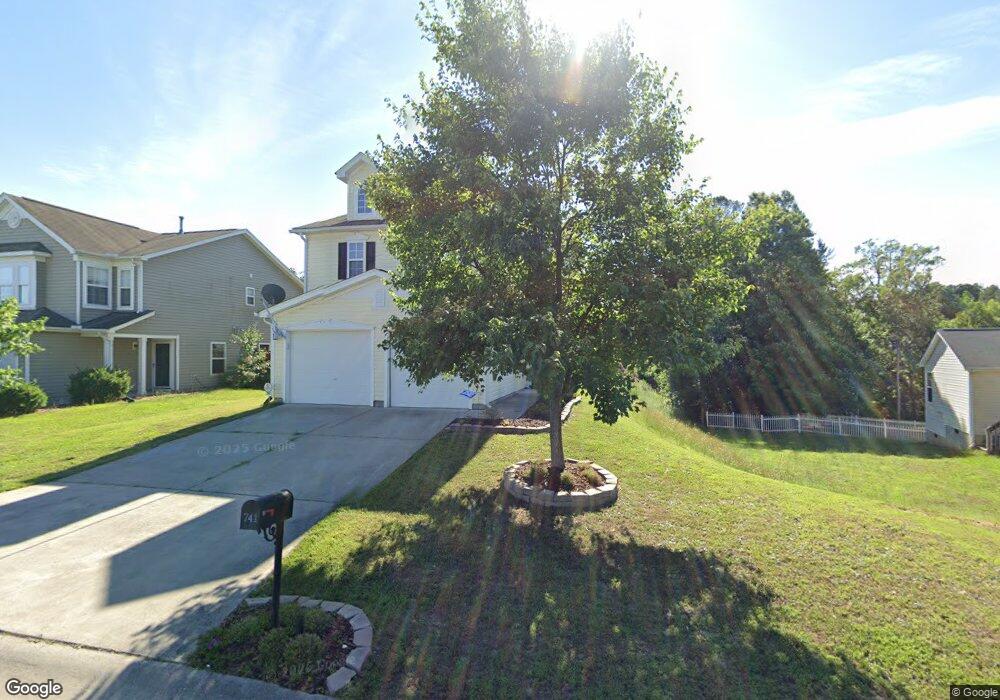
741 Obsidian Way Durham, NC 27703
Eastern Durham NeighborhoodEstimated Value: $367,314 - $399,000
3
Beds
3
Baths
2,108
Sq Ft
$181/Sq Ft
Est. Value
About This Home
This home is located at 741 Obsidian Way, Durham, NC 27703 and is currently estimated at $380,829, approximately $180 per square foot. 741 Obsidian Way is a home located in Durham County with nearby schools including Glenn Elementary, John W Neal Middle School, and Southern School of Energy & Sustainability.
Ownership History
Date
Name
Owned For
Owner Type
Purchase Details
Closed on
Feb 13, 2020
Sold by
Shill Christopher and Shill Emily
Bought by
Byers Daniel and Thomas Hannah
Current Estimated Value
Home Financials for this Owner
Home Financials are based on the most recent Mortgage that was taken out on this home.
Original Mortgage
$242,500
Outstanding Balance
$214,717
Interest Rate
3.6%
Mortgage Type
New Conventional
Estimated Equity
$166,112
Purchase Details
Closed on
May 15, 2017
Sold by
Young Kenneth T
Bought by
Shill Christopher and Shill Emily
Home Financials for this Owner
Home Financials are based on the most recent Mortgage that was taken out on this home.
Original Mortgage
$192,000
Interest Rate
4.5%
Mortgage Type
New Conventional
Purchase Details
Closed on
Jun 16, 2006
Sold by
Kb Home Raleigh Durham Llc
Bought by
Young Kenneth T and Ewing Tosha M
Home Financials for this Owner
Home Financials are based on the most recent Mortgage that was taken out on this home.
Original Mortgage
$161,610
Interest Rate
8.81%
Mortgage Type
Purchase Money Mortgage
Create a Home Valuation Report for This Property
The Home Valuation Report is an in-depth analysis detailing your home's value as well as a comparison with similar homes in the area
Home Values in the Area
Average Home Value in this Area
Purchase History
| Date | Buyer | Sale Price | Title Company |
|---|---|---|---|
| Byers Daniel | $250,000 | None Available | |
| Shill Christopher | $190,000 | -- | |
| Young Kenneth T | $162,000 | None Available |
Source: Public Records
Mortgage History
| Date | Status | Borrower | Loan Amount |
|---|---|---|---|
| Open | Byers Daniel | $242,500 | |
| Previous Owner | Shill Christopher | $192,000 | |
| Previous Owner | Young Kenneth T | $161,610 |
Source: Public Records
Tax History Compared to Growth
Tax History
| Year | Tax Paid | Tax Assessment Tax Assessment Total Assessment is a certain percentage of the fair market value that is determined by local assessors to be the total taxable value of land and additions on the property. | Land | Improvement |
|---|---|---|---|---|
| 2025 | $4,139 | $417,570 | $109,800 | $307,770 |
| 2024 | $2,844 | $203,853 | $30,450 | $173,403 |
| 2023 | $2,670 | $203,853 | $30,450 | $173,403 |
| 2022 | $2,609 | $203,853 | $30,450 | $173,403 |
| 2021 | $2,597 | $203,853 | $30,450 | $173,403 |
| 2020 | $2,536 | $203,853 | $30,450 | $173,403 |
| 2019 | $2,536 | $203,853 | $30,450 | $173,403 |
| 2018 | $2,334 | $172,085 | $24,360 | $147,725 |
| 2017 | $2,317 | $172,085 | $24,360 | $147,725 |
| 2016 | $2,239 | $172,085 | $24,360 | $147,725 |
| 2015 | $2,540 | $183,508 | $33,213 | $150,295 |
| 2014 | $2,540 | $183,508 | $33,213 | $150,295 |
Source: Public Records
Map
Nearby Homes
- 740 Obsidian Way
- 3602 Turquoise Dr
- 912 Obsidian Way
- 701 Grandview Dr
- 3615 Freeman Rd
- 521 Quartz Dr
- 4 Hertford Place
- 3507 Portico Ln
- 1011 Homecoming Way
- 1103 Kindness Ln
- 1114 Kindness Ln
- 612 Chivalry Dr
- 1143 Sweet Cream Ct
- 59 Enesco Cir
- 507 Chivalry Dr
- 2018 Cross Bones Blvd
- 2018 Cross Bones Blvd Unit 28
- 1060 Gentle Reed Dr
- 903 Outlaw Ave Unit Homesite 21
- 3306 Woodland Park Rd
- 739 Obsidian Way
- 3514 Thornwood Dr
- 3515 Thornwood Dr
- 3512 Thornwood Dr
- 737 Obsidian Way
- 3510 Thornwood Dr
- 11 Bentwood Place
- 735 Obsidian Way
- 3602 Thornwood Dr
- 13 Bentwood Place
- 738 Obsidian Way
- 3508 Thornwood Dr
- 733 Obsidian Way
- 3511 Thornwood Dr
- 9 Bentwood Place
- 736 Obsidian Way
- 3603 Thornwood Dr
- 14 Bentwood Place
- 731 Obsidian Way
- 6 Diamond Ct