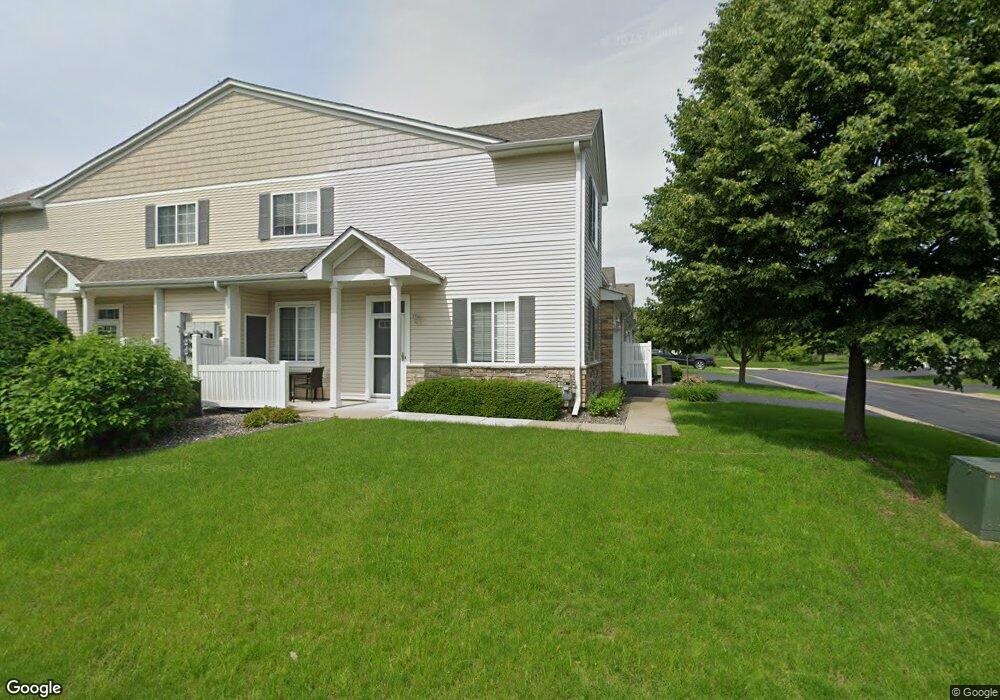
741 Willow Glen Dr Unit 804 Buffalo, MN 55313
Estimated Value: $253,000 - $286,000
3
Beds
2
Baths
1,628
Sq Ft
$164/Sq Ft
Est. Value
About This Home
This home is located at 741 Willow Glen Dr Unit 804, Buffalo, MN 55313 and is currently estimated at $266,806, approximately $163 per square foot. 741 Willow Glen Dr Unit 804 is a home located in Wright County with nearby schools including Parkside Elementary School, Buffalo Community Middle School, and Buffalo Senior High School.
Ownership History
Date
Name
Owned For
Owner Type
Purchase Details
Closed on
Nov 22, 2021
Sold by
Thoe Brent Randall and Thoe Christina Marie
Bought by
Hartneck Bradley T
Current Estimated Value
Home Financials for this Owner
Home Financials are based on the most recent Mortgage that was taken out on this home.
Original Mortgage
$160,000
Outstanding Balance
$146,592
Interest Rate
2.98%
Mortgage Type
New Conventional
Estimated Equity
$120,214
Purchase Details
Closed on
Dec 8, 2016
Sold by
Hockert Douglas G and Hockert Lorna M
Bought by
Thoe Brent Randall and Thoe Christina Marie
Purchase Details
Closed on
Feb 14, 2012
Sold by
Federal National Mortgage Association
Bought by
Hockert Douglas and Hockert Lorna
Purchase Details
Closed on
Nov 29, 2006
Sold by
Centex Homes Minnesota Division
Bought by
Soule Patricia M
Create a Home Valuation Report for This Property
The Home Valuation Report is an in-depth analysis detailing your home's value as well as a comparison with similar homes in the area
Home Values in the Area
Average Home Value in this Area
Purchase History
| Date | Buyer | Sale Price | Title Company |
|---|---|---|---|
| Hartneck Bradley T | $240,000 | Title Smart Inc | |
| Thoe Brent Randall | -- | Northland Title | |
| Hockert Douglas | $105,900 | -- | |
| Soule Patricia M | $151,990 | -- |
Source: Public Records
Mortgage History
| Date | Status | Borrower | Loan Amount |
|---|---|---|---|
| Open | Hartneck Bradley T | $160,000 |
Source: Public Records
Tax History Compared to Growth
Tax History
| Year | Tax Paid | Tax Assessment Tax Assessment Total Assessment is a certain percentage of the fair market value that is determined by local assessors to be the total taxable value of land and additions on the property. | Land | Improvement |
|---|---|---|---|---|
| 2025 | $2,806 | $246,300 | $30,000 | $216,300 |
| 2024 | $2,954 | $241,200 | $30,000 | $211,200 |
| 2023 | $2,912 | $256,100 | $35,000 | $221,100 |
| 2022 | $2,548 | $236,000 | $30,000 | $206,000 |
| 2021 | $2,568 | $190,200 | $30,000 | $160,200 |
| 2020 | $2,432 | $188,200 | $30,000 | $158,200 |
| 2019 | $2,156 | $174,600 | $0 | $0 |
| 2018 | $1,862 | $144,800 | $0 | $0 |
| 2017 | $1,642 | $124,400 | $0 | $0 |
| 2016 | $1,518 | $0 | $0 | $0 |
| 2015 | $1,334 | $0 | $0 | $0 |
| 2014 | -- | $0 | $0 | $0 |
Source: Public Records
Map
Nearby Homes
- 615 10th St S
- 815 Erickson Ln
- 823 Erickson Ln
- 912 Harvest Trail
- 914 Harvest Trail
- 905 Harvest Trail
- 825 Erickson Ln
- 818 Erickson Ln
- 829 Erickson Ln
- 822 Erickson Ln
- 911 Harvest Trail
- Biscayne Plan at Settlers Brook
- Courtland II Plan at Settlers Brook
- Walker Plan at Settlers Brook
- Emily Plan at Settlers Brook
- 703 Erickson Ln
- Baxter Plan at Settlers Brook
- Marquette Plan at Settlers Brook
- Berkley Plan at Settlers Brook
- Brighton Plan at Settlers Brook
- 741 Willow Glen Dr
- 733 Willow Glen Dr
- 733 Willow Glen Dr
- 743 Willow Glen Dr Unit 803
- 735 Willow Glen Dr
- 735 Willow Glen Dr
- 747 Willow Glen Dr
- 741 741 Willow Glen Dr
- 751 751 Willow Glen-Drive-
- 745 Willow Glen Dr
- 743 743 Willow Glen Dr
- 737 Willow Glen Dr
- 737 Willow Glen Dr Unit 807
- 745 745 Willow Glen-Drive-
- 745 745 Willow Glen Dr
- 739 739 Willow Glenn-Drive-
- 739 Willow Glen Dr
- 749 Willow Glen Dr
- 751 Willow Glen Dr
- 751 Willow Glen Dr