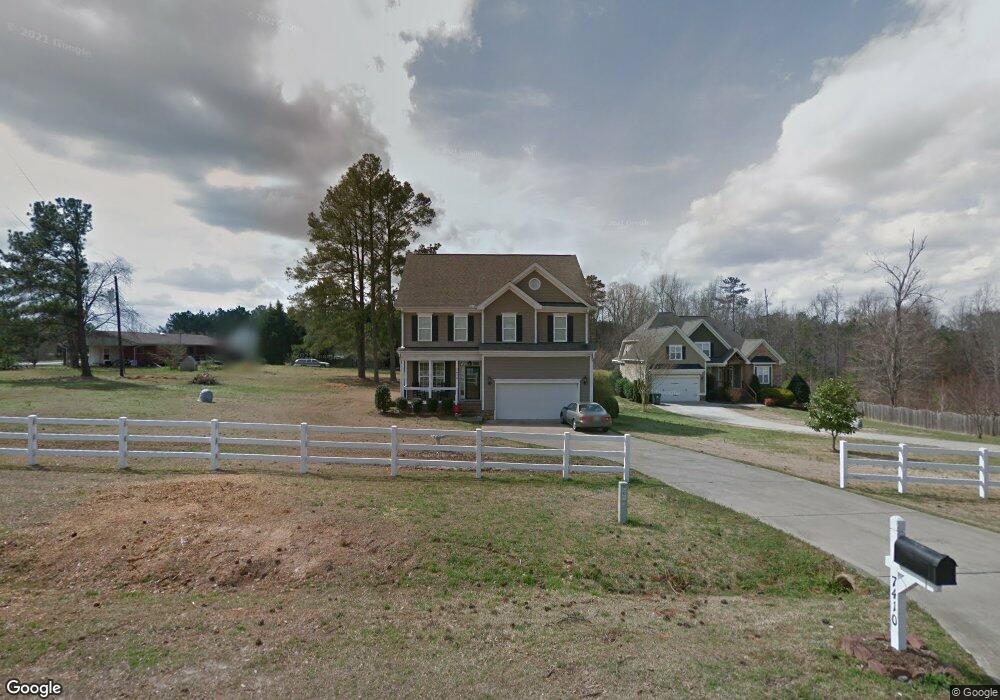
7410 Denlee Rd Raleigh, NC 27603
Estimated Value: $572,402 - $639,000
--
Bed
3
Baths
2,255
Sq Ft
$270/Sq Ft
Est. Value
About This Home
This home is located at 7410 Denlee Rd, Raleigh, NC 27603 and is currently estimated at $609,601, approximately $270 per square foot. 7410 Denlee Rd is a home located in Wake County with nearby schools including Yates Mill Elementary School, Dillard Drive Magnet Middle School, and Middle Creek High.
Ownership History
Date
Name
Owned For
Owner Type
Purchase Details
Closed on
Nov 21, 2018
Sold by
Trantham Paula B
Bought by
Trantham Paula B and Fenters Kevin E
Current Estimated Value
Home Financials for this Owner
Home Financials are based on the most recent Mortgage that was taken out on this home.
Original Mortgage
$241,000
Outstanding Balance
$183,369
Interest Rate
4.9%
Mortgage Type
New Conventional
Estimated Equity
$426,232
Purchase Details
Closed on
Jul 10, 2008
Sold by
Empire Contractors Inc
Bought by
Trantham Paula B
Home Financials for this Owner
Home Financials are based on the most recent Mortgage that was taken out on this home.
Original Mortgage
$275,360
Interest Rate
6.08%
Mortgage Type
FHA
Purchase Details
Closed on
May 11, 2006
Sold by
Sorrell Charles Ray and Sorrell Joann N
Bought by
Empire Contractors Inc
Create a Home Valuation Report for This Property
The Home Valuation Report is an in-depth analysis detailing your home's value as well as a comparison with similar homes in the area
Home Values in the Area
Average Home Value in this Area
Purchase History
| Date | Buyer | Sale Price | Title Company |
|---|---|---|---|
| Trantham Paula B | -- | None Available | |
| Trantham Paula B | $286,000 | None Available | |
| Empire Contractors Inc | $455,500 | None Available |
Source: Public Records
Mortgage History
| Date | Status | Borrower | Loan Amount |
|---|---|---|---|
| Open | Trantham Paula B | $241,000 | |
| Closed | Trantham Paula B | $275,360 |
Source: Public Records
Tax History Compared to Growth
Tax History
| Year | Tax Paid | Tax Assessment Tax Assessment Total Assessment is a certain percentage of the fair market value that is determined by local assessors to be the total taxable value of land and additions on the property. | Land | Improvement |
|---|---|---|---|---|
| 2025 | $3,333 | $518,017 | $103,500 | $414,517 |
| 2024 | $3,237 | $518,017 | $103,500 | $414,517 |
| 2023 | $2,556 | $325,302 | $55,440 | $269,862 |
| 2022 | $2,369 | $325,302 | $55,440 | $269,862 |
| 2021 | $2,306 | $325,302 | $55,440 | $269,862 |
| 2020 | $2,268 | $325,302 | $55,440 | $269,862 |
| 2019 | $2,335 | $283,517 | $73,920 | $209,597 |
| 2018 | $2,148 | $283,517 | $73,920 | $209,597 |
| 2017 | $2,036 | $283,517 | $73,920 | $209,597 |
| 2016 | $1,995 | $283,517 | $73,920 | $209,597 |
| 2015 | $2,126 | $303,291 | $101,200 | $202,091 |
| 2014 | -- | $303,291 | $101,200 | $202,091 |
Source: Public Records
Map
Nearby Homes
- 6913 Lake Wheeler Rd
- 3204 Manor Ridge Dr
- 3613 Cross Timber Ln
- 7612 Fayetteville Rd
- 3716 Cross Timber Ln
- 5702 Volos Ave
- 246 Broomside Ave
- 7625 Fayetteville Rd
- 5300 Trilogy Farm Dr
- 529 Prestonfield Way
- 716 Ben Ledi Ct
- 5009 Megara Run
- 416 Grange Farm Place
- 521 Prestonfield Way
- 457 Grange Farm Place
- 414 Grange Farm Place
- 464 Grange Farm Place
- 3901 Bluffwind Dr
- 3728 Westbury Lake Dr
- 432 Grange Farm Place
- 7400 Denlee Rd
- 7332 Denlee Rd
- 7332 Denlee Rd Unit 3
- 7409 Denlee Rd
- 7508 Lake Wheeler Rd
- 7425 Denlee Rd
- 7328 Denlee Rd
- 7328 Denlee Rd Unit 4
- 7516 Lake Wheeler Rd
- 7324 Denlee Rd
- 7324 Denlee Rd Unit 5
- 7321 Denlee Rd
- 7320 Denlee Rd
- 7600 Lake Wheeler Rd
- 7408 Lake Wheeler Rd
- 7401 Denlee Rd
- 7404 Lake Wheeler Rd
- 7316 Denlee Rd
- 7317 Denlee Rd
- 7313 Denlee Rd