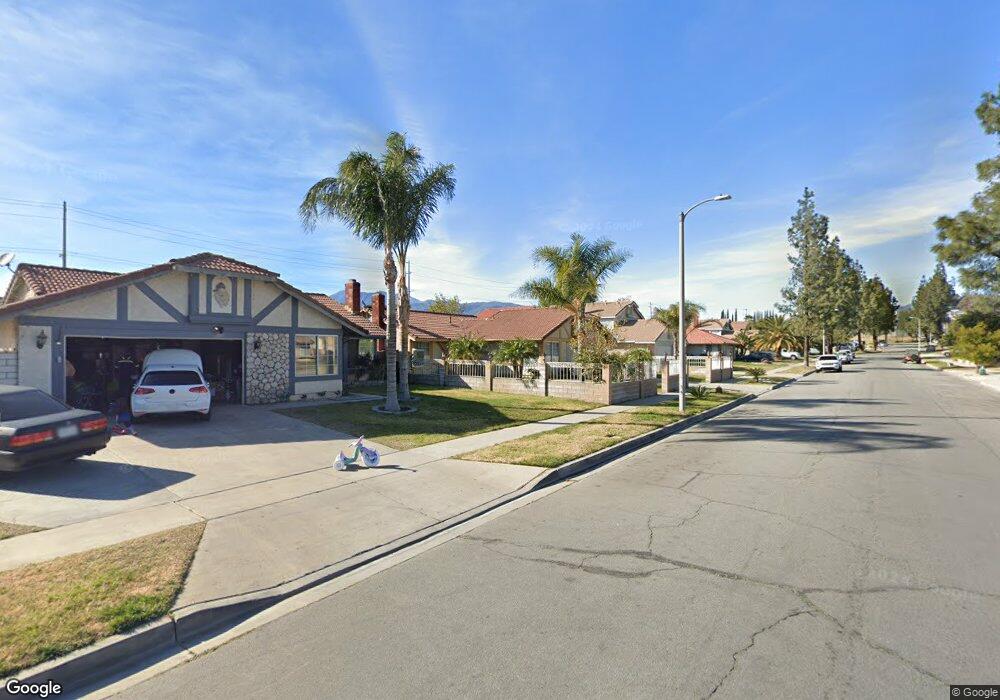
7410 Ferndale Ave Fontana, CA 92336
Estimated Value: $577,000 - $630,000
4
Beds
2
Baths
1,344
Sq Ft
$441/Sq Ft
Est. Value
About This Home
This home is located at 7410 Ferndale Ave, Fontana, CA 92336 and is currently estimated at $592,296, approximately $440 per square foot. 7410 Ferndale Ave is a home located in San Bernardino County with nearby schools including Locust Elementary School, Alder Middle School, and Fontana A. B. Miller High School.
Ownership History
Date
Name
Owned For
Owner Type
Purchase Details
Closed on
Sep 4, 2021
Sold by
Zepeda Apolonio and De Zepeda Marina
Bought by
Zepeda Apolonio and De Zepeda Marina
Current Estimated Value
Purchase Details
Closed on
Dec 21, 2001
Sold by
Team Enterprises Inc
Bought by
Zepeda Apolonio and Zepeda Marina
Home Financials for this Owner
Home Financials are based on the most recent Mortgage that was taken out on this home.
Original Mortgage
$142,759
Interest Rate
7.13%
Mortgage Type
FHA
Purchase Details
Closed on
Jul 2, 1998
Sold by
Glover Ronald Scott and Glover Clara Leticia
Bought by
Team Enterprises Inc
Purchase Details
Closed on
Sep 7, 1994
Sold by
Baca Tom A and Baca Juanita
Bought by
Glover Ronald Scott and Glover Clara Leticia
Home Financials for this Owner
Home Financials are based on the most recent Mortgage that was taken out on this home.
Original Mortgage
$115,668
Interest Rate
8.5%
Mortgage Type
Assumption
Create a Home Valuation Report for This Property
The Home Valuation Report is an in-depth analysis detailing your home's value as well as a comparison with similar homes in the area
Home Values in the Area
Average Home Value in this Area
Purchase History
| Date | Buyer | Sale Price | Title Company |
|---|---|---|---|
| Zepeda Apolonio | -- | None Available | |
| Zepeda Apolonio | $145,000 | Orange Coast Title | |
| Team Enterprises Inc | -- | -- | |
| Glover Ronald Scott | $113,500 | Fidelity National Title Ins |
Source: Public Records
Mortgage History
| Date | Status | Borrower | Loan Amount |
|---|---|---|---|
| Previous Owner | Zepeda Apolonio | $142,759 | |
| Previous Owner | Glover Ronald Scott | $115,668 |
Source: Public Records
Tax History Compared to Growth
Tax History
| Year | Tax Paid | Tax Assessment Tax Assessment Total Assessment is a certain percentage of the fair market value that is determined by local assessors to be the total taxable value of land and additions on the property. | Land | Improvement |
|---|---|---|---|---|
| 2025 | $3,202 | $214,203 | $53,548 | $160,655 |
| 2024 | $3,202 | $210,003 | $52,498 | $157,505 |
| 2023 | $2,578 | $205,886 | $51,469 | $154,417 |
| 2022 | $2,551 | $201,849 | $50,460 | $151,389 |
| 2021 | $2,441 | $197,892 | $49,471 | $148,421 |
| 2020 | $2,421 | $195,863 | $48,964 | $146,899 |
| 2019 | $2,357 | $192,023 | $48,004 | $144,019 |
| 2018 | $2,367 | $188,258 | $47,063 | $141,195 |
| 2017 | $2,328 | $184,566 | $46,140 | $138,426 |
| 2016 | $2,268 | $180,947 | $45,235 | $135,712 |
| 2015 | $2,222 | $178,229 | $44,556 | $133,673 |
| 2014 | $2,208 | $174,738 | $43,683 | $131,055 |
Source: Public Records
Map
Nearby Homes
- 7724 Myles Ct
- 18281 Montgomery Ave
- 7398 N Maple Ave
- 17806 Terry St
- 7835 Laurel Ave
- 17571 Shamrock Ave
- 7852 Grace Ave
- 956 N Sandalwood Ave
- 7740 Lombardy Ave
- 7870 Williams Rd
- 7925 Spohn Ave
- 645 N Maple Ave
- 7936 Alder Ave
- 17548 Court St
- 17562 Court St
- 17848 17858 Foothill Blvd
- 8019 Alder Ave
- 18045 Foothill Blvd
- 7738 Encinitas Ave
- 17341 Fairfax St
- 7400 Ferndale Ave
- 7420 Ferndale Ave
- 7415 Laurel Ave
- 7405 Laurel Ave
- 7425 Laurel Ave
- 7390 Ferndale Ave
- 7430 Ferndale Ave
- 7415 Ferndale Ave
- 7405 Ferndale Ave
- 7395 Laurel Ave
- 7435 Laurel Ave
- 7425 Ferndale Ave
- 7395 Ferndale Ave
- 7380 Ferndale Ave
- 7435 Ferndale Ave
- 7385 Laurel Ave
- 7400 Grace St
- 17945 Montgomery Ave
- 7410 Grace St
- 7430 Laurel Ave