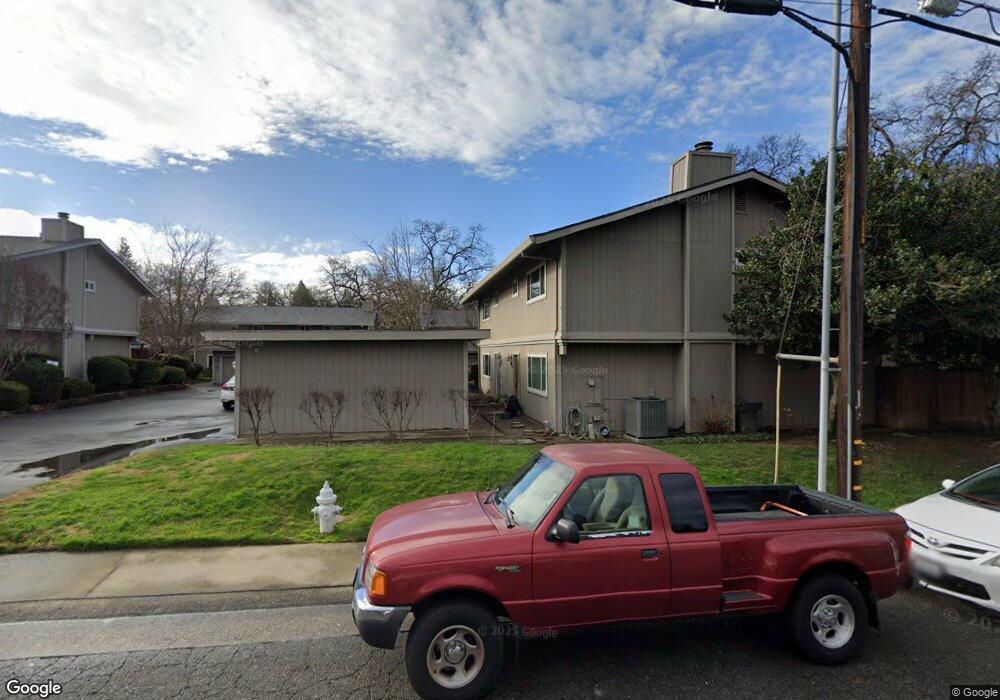
7412 Ranch Ave Citrus Heights, CA 95610
Estimated Value: $359,000 - $471,000
3
Beds
2
Baths
1,683
Sq Ft
$244/Sq Ft
Est. Value
About This Home
This home is located at 7412 Ranch Ave, Citrus Heights, CA 95610 and is currently estimated at $411,433, approximately $244 per square foot. 7412 Ranch Ave is a home located in Sacramento County with nearby schools including Skycrest Elementary School, Will Rogers Middle School, and San Juan High School.
Ownership History
Date
Name
Owned For
Owner Type
Purchase Details
Closed on
May 22, 2008
Sold by
U S Bank Na
Bought by
Hewitt Charles R and Hewitt Abigail G
Current Estimated Value
Purchase Details
Closed on
Apr 4, 2008
Sold by
Amyx Randy and Amyx Kimberly
Bought by
U S Bank Na
Purchase Details
Closed on
Jul 12, 2005
Sold by
Frankie Christopher John P and Frankie Christopher
Bought by
Amyx Randy and Amyx Kimberly
Home Financials for this Owner
Home Financials are based on the most recent Mortgage that was taken out on this home.
Original Mortgage
$250,400
Interest Rate
5.99%
Mortgage Type
Purchase Money Mortgage
Purchase Details
Closed on
May 12, 1999
Sold by
Victor Daniel C
Bought by
Frankie Christopher John P and Frankie Christopher
Home Financials for this Owner
Home Financials are based on the most recent Mortgage that was taken out on this home.
Original Mortgage
$110,188
Interest Rate
6.92%
Mortgage Type
FHA
Create a Home Valuation Report for This Property
The Home Valuation Report is an in-depth analysis detailing your home's value as well as a comparison with similar homes in the area
Home Values in the Area
Average Home Value in this Area
Purchase History
| Date | Buyer | Sale Price | Title Company |
|---|---|---|---|
| Hewitt Charles R | $176,000 | First American Title Company | |
| U S Bank Na | $234,000 | First American Title Company | |
| Amyx Randy | $313,000 | Placer Title Company | |
| Frankie Christopher John P | $111,000 | North American Title Guarant |
Source: Public Records
Mortgage History
| Date | Status | Borrower | Loan Amount |
|---|---|---|---|
| Previous Owner | Amyx Randy | $250,400 | |
| Previous Owner | Frankie Christopher John P | $110,188 |
Source: Public Records
Tax History
| Year | Tax Paid | Tax Assessment Tax Assessment Total Assessment is a certain percentage of the fair market value that is determined by local assessors to be the total taxable value of land and additions on the property. | Land | Improvement |
|---|---|---|---|---|
| 2025 | $2,744 | $231,031 | $65,669 | $165,362 |
| 2024 | $2,744 | $226,502 | $64,382 | $162,120 |
| 2023 | $2,674 | $222,062 | $63,120 | $158,942 |
| 2022 | $2,661 | $217,709 | $61,883 | $155,826 |
| 2021 | $2,617 | $213,441 | $60,670 | $152,771 |
| 2020 | $2,568 | $211,253 | $60,048 | $151,205 |
| 2019 | $2,517 | $207,112 | $58,871 | $148,241 |
| 2018 | $2,488 | $203,052 | $57,717 | $145,335 |
| 2017 | $2,464 | $199,072 | $56,586 | $142,486 |
| 2016 | $2,303 | $195,170 | $55,477 | $139,693 |
| 2015 | $2,264 | $192,239 | $54,644 | $137,595 |
| 2014 | $2,217 | $188,474 | $53,574 | $134,900 |
Source: Public Records
Map
Nearby Homes
- 7428 Ranch Ave
- 7436 Ranch Ave
- 7408 Westgate Dr
- 5701 Chipping Way
- 5829 San Juan Ave Unit 1
- 7544 Twin Bridges Ln
- 5832 Northgrove Way
- 7548 Twin Bridges Ln
- 7423 Kalamazoo Dr
- 5513 San Juan Ave
- 5520 Twin Bridges Loop
- 7235 Castilian Ct
- 5765 Sperry Dr
- 7595 Twin Bridges Ln
- 7200 Spicer Dr
- 7457 Farmgate Way
- 7613 Northeast Cir
- 5839 Sperry Dr
- 5861 Sperry Dr
- 6054 Peoria Dr
- 7410 Ranch Ave
- 7426 Ranch Ave
- 7414 Ranch Ave
- 7420 Ranch Ave
- 7416 Ranch Ave
- 0 Ranch Ave
- 7422 Ranch Ave
- 7424 Ranch Ave
- 7430 Ranch Ave
- 7422 Wisconsin Dr
- 7428 Wisconsin Dr
- 7432 Ranch Ave
- 7435 Ranch Ave
- 7416 Wisconsin Dr
- 5680 San Juan Ave
- 5716 San Juan Ave
- 7439 Ranch Ave
- 7438 Ranch Ave
- 7434 Ranch Ave
- 7440 Ranch Ave
Your Personal Tour Guide
Ask me questions while you tour the home.