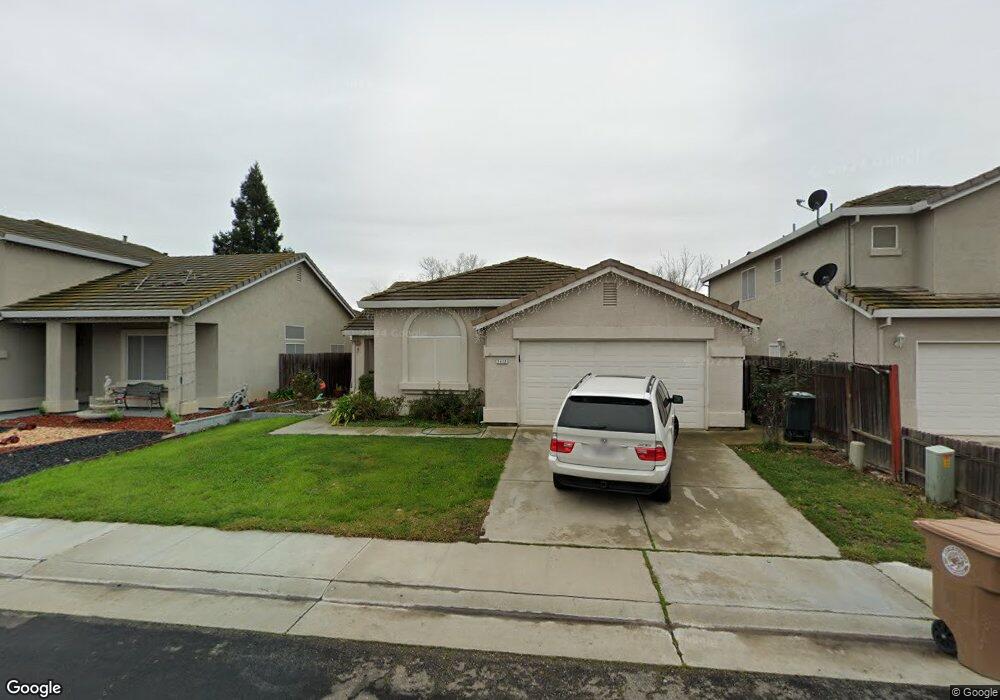
7412 Song Sparrow Way Elk Grove, CA 95758
North West Elk Grove NeighborhoodEstimated Value: $534,000 - $580,000
4
Beds
2
Baths
1,636
Sq Ft
$342/Sq Ft
Est. Value
About This Home
This home is located at 7412 Song Sparrow Way, Elk Grove, CA 95758 and is currently estimated at $560,039, approximately $342 per square foot. 7412 Song Sparrow Way is a home located in Sacramento County with nearby schools including Elitha Donner Elementary School, Harriet G. Eddy Middle School, and Laguna Creek High School.
Ownership History
Date
Name
Owned For
Owner Type
Purchase Details
Closed on
Sep 7, 2016
Sold by
Larson James A
Bought by
Larson James A
Current Estimated Value
Home Financials for this Owner
Home Financials are based on the most recent Mortgage that was taken out on this home.
Interest Rate
3.46%
Purchase Details
Closed on
Feb 4, 2014
Sold by
Larson James A and Larson Kathleen S
Bought by
James A & Kathleen S Larson Family Trust
Purchase Details
Closed on
Jul 30, 2003
Sold by
Lepera John J and Lepera Alda
Bought by
Larson James A and Larson Kathleen S
Purchase Details
Closed on
Feb 24, 2003
Sold by
Lepera John J and Lepera Alda
Bought by
Lepera John J and Lepera Alda
Purchase Details
Closed on
May 27, 1998
Sold by
The Forecast Group Lp
Bought by
Lepera John L and Lepera Alda
Home Financials for this Owner
Home Financials are based on the most recent Mortgage that was taken out on this home.
Original Mortgage
$80,000
Interest Rate
7.1%
Create a Home Valuation Report for This Property
The Home Valuation Report is an in-depth analysis detailing your home's value as well as a comparison with similar homes in the area
Home Values in the Area
Average Home Value in this Area
Purchase History
| Date | Buyer | Sale Price | Title Company |
|---|---|---|---|
| Larson James A | -- | -- | |
| James A & Kathleen S Larson Family Trust | -- | None Available | |
| Larson James A | -- | None Available | |
| Larson James A | $287,500 | Fidelity National Title Co | |
| Lepera John J | -- | -- | |
| Lepera John L | $138,000 | Orange Coast Title Company |
Source: Public Records
Mortgage History
| Date | Status | Borrower | Loan Amount |
|---|---|---|---|
| Closed | Larson James A | -- | |
| Previous Owner | Larson James A | $97,000 | |
| Previous Owner | Lepera John L | $80,000 |
Source: Public Records
Tax History Compared to Growth
Tax History
| Year | Tax Paid | Tax Assessment Tax Assessment Total Assessment is a certain percentage of the fair market value that is determined by local assessors to be the total taxable value of land and additions on the property. | Land | Improvement |
|---|---|---|---|---|
| 2025 | $4,720 | $408,746 | $85,298 | $323,448 |
| 2024 | $4,720 | $400,732 | $83,626 | $317,106 |
| 2023 | $4,599 | $392,876 | $81,987 | $310,889 |
| 2022 | $4,507 | $385,174 | $80,380 | $304,794 |
| 2021 | $4,436 | $377,622 | $78,804 | $298,818 |
| 2020 | $4,375 | $373,750 | $77,996 | $295,754 |
| 2019 | $4,292 | $366,422 | $76,467 | $289,955 |
| 2018 | $4,176 | $359,238 | $74,968 | $284,270 |
| 2017 | $4,101 | $352,196 | $73,499 | $278,697 |
| 2016 | $3,898 | $345,291 | $72,058 | $273,233 |
| 2015 | $6,176 | $314,230 | $65,577 | $248,653 |
| 2014 | $3,390 | $296,443 | $61,865 | $234,578 |
Source: Public Records
Map
Nearby Homes
- 9193 Bungalow Way
- 9217 Trenholm Dr
- 7013 Sandy Souza Way
- 7213 Tiant Way
- 8935 Cypress View Way
- 6813 Springridge Way
- 9252 Faraway Place
- 9084 Fresca Way
- 7021 Tiant Way
- 7105 Fall Way
- 7664 Walpole Way
- 8869 Jessup Ct
- 8840 Stratham Way
- 6701 Venetian Ct
- 8225 Wooded Brook Dr
- 9236 Mapleview Way
- 8158 Kramer Ranch Ln
- 8170 Kramer Ranch Ln
- 8150 Kramer Ranch Ln
- 9357 Hoyleton Way
- 7408 Song Sparrow Way
- 7416 Song Sparrow Way
- 7420 Song Sparrow Way
- 7404 Song Sparrow Way
- 8989 Generations Dr
- 9051 New Age Ct
- 8983 Generations Dr Unit 4
- 8993 Generations Dr
- 7503 Song Sparrow Way
- 7424 Song Sparrow Way
- 7400 Song Sparrow Way
- 8979 Generations Dr
- 9047 New Age Ct
- 8997 Generations Dr
- 7405 Song Sparrow Way
- 7507 Song Sparrow Way
- 9051 Descendant Dr
- 7428 Song Sparrow Way
- 9043 New Age Ct
- 9001 Generations Dr