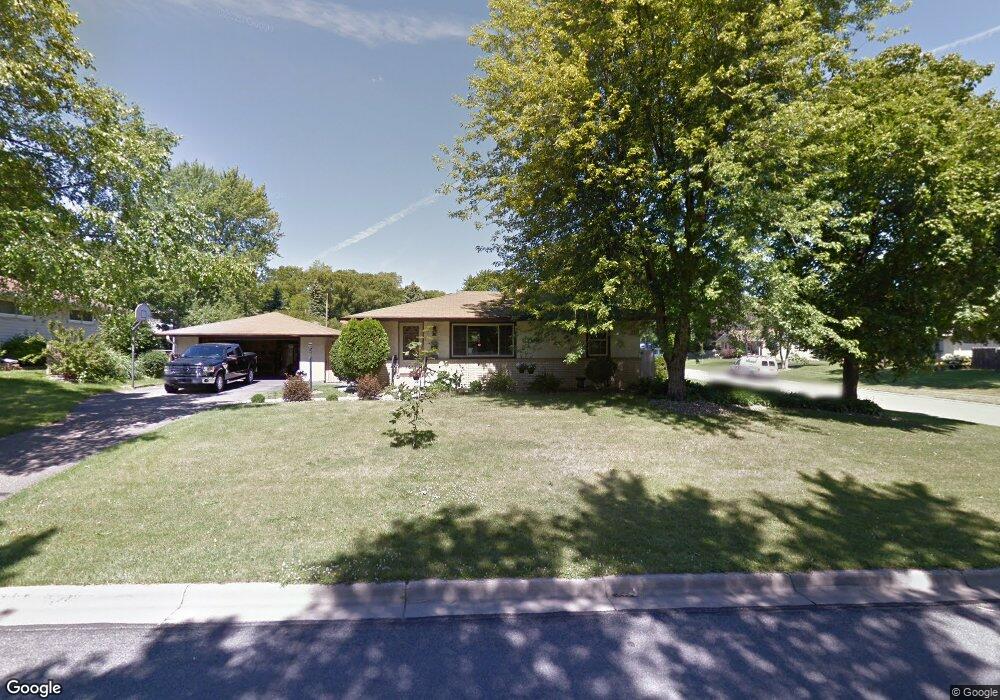
7413 Cloman Way E Inver Grove Heights, MN 55076
Estimated Value: $316,000 - $362,000
4
Beds
2
Baths
1,628
Sq Ft
$206/Sq Ft
Est. Value
About This Home
This home is located at 7413 Cloman Way E, Inver Grove Heights, MN 55076 and is currently estimated at $334,689, approximately $205 per square foot. 7413 Cloman Way E is a home located in Dakota County with nearby schools including Hilltop Elementary School, Inver Grove Heights Middle School, and Simley Senior High School.
Ownership History
Date
Name
Owned For
Owner Type
Purchase Details
Closed on
Jan 25, 2019
Sold by
Mickelson Anthony D and Mickelson Heather M
Bought by
Mickelson Anthony D and Mickelson Heather M
Current Estimated Value
Purchase Details
Closed on
Jun 28, 2013
Sold by
Dahl Nathanael E and Dahl Lisa B
Bought by
Mickelson Anthony D
Home Financials for this Owner
Home Financials are based on the most recent Mortgage that was taken out on this home.
Original Mortgage
$190,486
Outstanding Balance
$134,507
Interest Rate
3.25%
Mortgage Type
FHA
Estimated Equity
$200,182
Purchase Details
Closed on
Dec 15, 2004
Sold by
Simpson Matthew F and Simpson Tracy M
Bought by
Dahl Lisa B and Dahl Nathanael E
Create a Home Valuation Report for This Property
The Home Valuation Report is an in-depth analysis detailing your home's value as well as a comparison with similar homes in the area
Home Values in the Area
Average Home Value in this Area
Purchase History
| Date | Buyer | Sale Price | Title Company |
|---|---|---|---|
| Mickelson Anthony D | -- | None Available | |
| Mickelson Anthony D | $194,000 | All American Title Company | |
| Dahl Lisa B | $218,500 | -- |
Source: Public Records
Mortgage History
| Date | Status | Borrower | Loan Amount |
|---|---|---|---|
| Open | Mickelson Anthony D | $190,486 |
Source: Public Records
Tax History Compared to Growth
Tax History
| Year | Tax Paid | Tax Assessment Tax Assessment Total Assessment is a certain percentage of the fair market value that is determined by local assessors to be the total taxable value of land and additions on the property. | Land | Improvement |
|---|---|---|---|---|
| 2024 | $2,952 | $303,500 | $75,800 | $227,700 |
| 2023 | $2,952 | $293,500 | $73,900 | $219,600 |
| 2022 | $2,596 | $290,900 | $73,800 | $217,100 |
| 2021 | $2,552 | $244,800 | $63,000 | $181,800 |
| 2020 | $2,506 | $237,300 | $60,000 | $177,300 |
| 2019 | $2,457 | $232,900 | $57,100 | $175,800 |
| 2018 | $2,227 | $215,000 | $54,400 | $160,600 |
| 2017 | $2,054 | $195,900 | $51,800 | $144,100 |
| 2016 | $2,012 | $180,600 | $49,400 | $131,200 |
| 2015 | $2,054 | $156,453 | $42,437 | $114,016 |
| 2014 | -- | $151,439 | $40,594 | $110,845 |
| 2013 | -- | $134,980 | $36,906 | $98,074 |
Source: Public Records
Map
Nearby Homes
- 7447 Cloman Way
- 3650 75th St E
- 7393 Clayton Ave
- 7614 Connie Ln
- 3617 76th Ln E
- 7169 Clay Ave
- 3861 Conroy Trail
- 3901 Conroy Trail
- 3907 Conroy Trail
- 4049 75th St E
- 7344 Degrio Way
- 7944 Charles Way
- 6951 Clay Ave
- 3085 Upper 76th St E
- 6931 Crosby Ave
- 3580 68th St E
- 7996 Corey Path
- 3548 Cloman Way
- 8086 Dana Path
- 8104 Dana Path
- 7413 Cloman Way
- 7359 Cleve Ave
- 7431 Cloman Way
- 3642 74th St E
- 3645 Upper 73rd St E
- 7420 Cleadis Way
- 7408 Cleadis Way
- 7360 Cleve Ave
- 7432 Cloman Way
- 7430 Cleadis Way
- 7350 Cleve Ave
- 7462 Cloman Way
- 7440 Cleadis Way
- 3655 Upper 73rd St E
- 3656 74th St E
- 7461 Cloman Way
- 3648 Upper 73rd St E
- 3628 73rd St E
- 7456 Cleadis Way
- 3675 74th St E