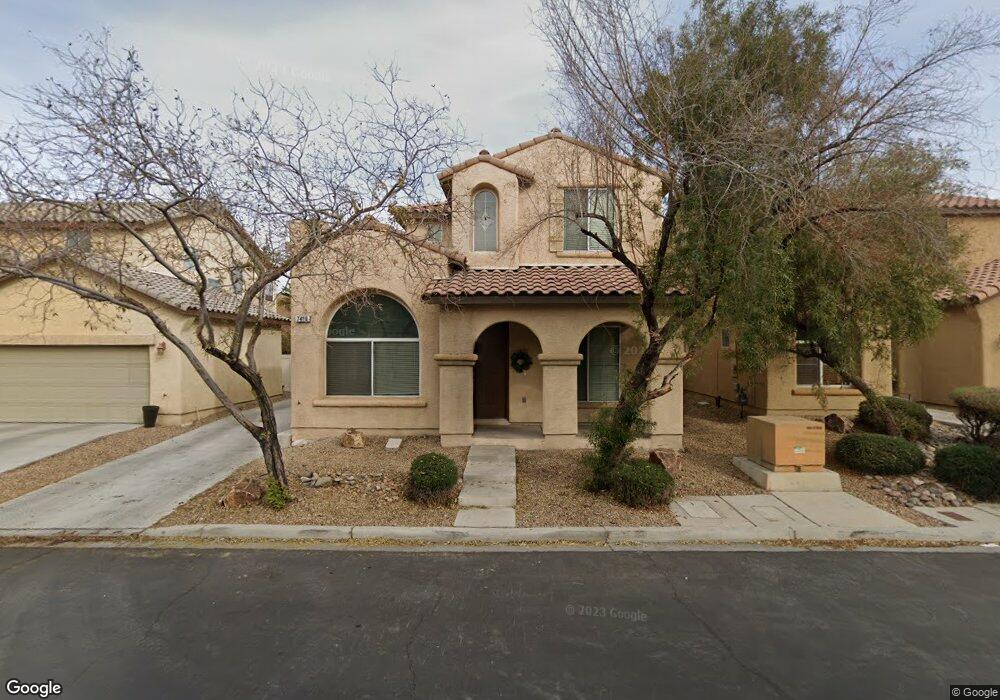
7416 Emerald Glow St Las Vegas, NV 89123
Silverado Ranch NeighborhoodEstimated Value: $443,716 - $478,000
3
Beds
3
Baths
1,800
Sq Ft
$260/Sq Ft
Est. Value
About This Home
This home is located at 7416 Emerald Glow St, Las Vegas, NV 89123 and is currently estimated at $467,929, approximately $259 per square foot. 7416 Emerald Glow St is a home located in Clark County with nearby schools including Charlotte Hill Elementary School, Louis Wiener Jr Elementary School, and Jack Lund Schofield Middle School.
Ownership History
Date
Name
Owned For
Owner Type
Purchase Details
Closed on
Jun 14, 2021
Sold by
True North Property Owner A Llc
Bought by
True North Property Owner A Llc
Current Estimated Value
Purchase Details
Closed on
May 23, 2019
Sold by
Pmc Sfr Equity Owner 1 Llc
Bought by
Pmc Sfr Borrower Llc
Purchase Details
Closed on
Mar 14, 2018
Sold by
Wilmington Savings Fund Society Fsb
Bought by
Pmc Sfr Holding Llc
Purchase Details
Closed on
Jan 17, 2017
Sold by
Aberman Selima K
Bought by
Wilmington Savings Fund Society and Christiana Trust
Purchase Details
Closed on
Sep 19, 2005
Sold by
Aberman Shawn L
Bought by
Aberman Selima K
Home Financials for this Owner
Home Financials are based on the most recent Mortgage that was taken out on this home.
Original Mortgage
$283,200
Interest Rate
1%
Mortgage Type
Negative Amortization
Create a Home Valuation Report for This Property
The Home Valuation Report is an in-depth analysis detailing your home's value as well as a comparison with similar homes in the area
Home Values in the Area
Average Home Value in this Area
Purchase History
| Date | Buyer | Sale Price | Title Company |
|---|---|---|---|
| True North Property Owner A Llc | -- | Servicelink | |
| Pmc Sfr Borrower Llc | -- | Os National Llc | |
| Pmc Sfr Equity Owner 1 Llc | -- | Os National Llc | |
| Pmc Sfr Holding Llc | -- | Os National Title | |
| Wilmington Savings Fund Society | $320,240 | Servicelink Aliquippa Title | |
| Aberman Selima K | -- | Stewart Title Of Nevada | |
| Aberman Selima K | $354,033 | Stewart Title Of Nevada |
Source: Public Records
Mortgage History
| Date | Status | Borrower | Loan Amount |
|---|---|---|---|
| Previous Owner | Aberman Selima K | $283,200 |
Source: Public Records
Tax History Compared to Growth
Tax History
| Year | Tax Paid | Tax Assessment Tax Assessment Total Assessment is a certain percentage of the fair market value that is determined by local assessors to be the total taxable value of land and additions on the property. | Land | Improvement |
|---|---|---|---|---|
| 2025 | $2,285 | $118,083 | $35,700 | $82,383 |
| 2024 | $2,116 | $118,083 | $35,700 | $82,383 |
| 2023 | $2,116 | $109,534 | $32,200 | $77,334 |
| 2022 | $1,960 | $99,301 | $28,700 | $70,601 |
| 2021 | $1,815 | $91,736 | $24,850 | $66,886 |
| 2020 | $1,682 | $89,926 | $23,800 | $66,126 |
| 2019 | $1,577 | $87,109 | $22,050 | $65,059 |
| 2018 | $1,504 | $80,175 | $17,850 | $62,325 |
| 2017 | $2,374 | $80,943 | $17,850 | $63,093 |
| 2016 | $1,661 | $66,735 | $14,000 | $52,735 |
| 2015 | $1,658 | $51,209 | $9,800 | $41,409 |
| 2014 | $1,614 | $45,048 | $7,000 | $38,048 |
Source: Public Records
Map
Nearby Homes
- 1026 Pearl Isle Ct
- 7384 Emerald Glow St
- 7400 Emerald Glow St
- 7374 Valhalla Ln
- 7668 Friendly Breeze Ct
- 1252 Little Sidnee Dr
- 7091 Rhapsody Ln
- 7083 Gunslinger St
- 884 E Robindale Rd
- 7253 Abbeyville Dr
- 7585 Hartwell Dr
- 7745 Radcliff St
- 7751 Radcliff St
- 747 Canyon Crest Dr
- 7126 Sawtooth Dr
- 614 Ravenglen Dr
- 1461 Lawman Ct
- 7492 Puritan Ave
- 1585 Siboney Dr
- 1496 Lawman Ct
- 7424 Emerald Glow St
- 7408 Emerald Glow St
- 7408 Emerald Glow St
- 7432 Emerald Glow St
- 7440 Emerald Glow St
- 7392 Emerald Glow St
- 1058 Garnet Ridge Ct
- 7448 Emerald Glow St
- 1037 Pearl Isle Ct
- 1048 Garnet Ridge Ct
- 1036 Pearl Isle Ct
- 7456 Emerald Glow St
- 1027 Pearl Isle Ct
- 1038 Garnet Ridge Ct
- 1028 Garnet Ridge Ct
- 7464 Emerald Glow St
- 1017 Pearl Isle Ct
- 1069 Garnet Ridge Ct
- 1016 Pearl Isle Ct
- 1079 Garnet Ridge Ct